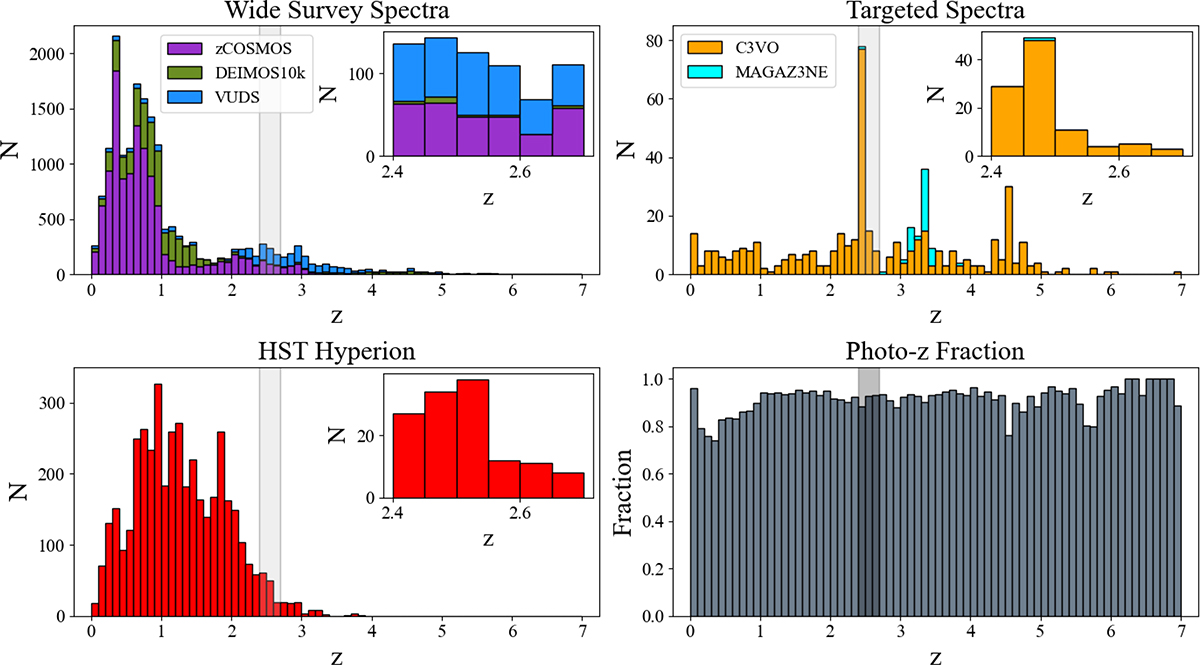
Fig. 1.
Download original image
Source breakdown as a function of redshift for objects in our final catalog based on the cuts detailed in Section 3.1. Sources from different methods are shown in different panels: wide field spectroscopic surveys (top left), targeted spectra (top right), and HST Hyperion (bottom left). Rather than including a histogram of photometric redshift counts, we include the photometric redshift fraction (i.e. the fraction of galaxies with only a photometric redshift measured) for reference on the bottom right. The location of Hyperion is included in each panel as a shaded gray region (2.4 < z < 2.7), and insets for this shaded region are included for the spectroscopic and grism redshift panels. Histograms with multiple survey sources are stacked.
Current usage metrics show cumulative count of Article Views (full-text article views including HTML views, PDF and ePub downloads, according to the available data) and Abstracts Views on Vision4Press platform.
Data correspond to usage on the plateform after 2015. The current usage metrics is available 48-96 hours after online publication and is updated daily on week days.
Initial download of the metrics may take a while.