Fig. 12.
Download original image
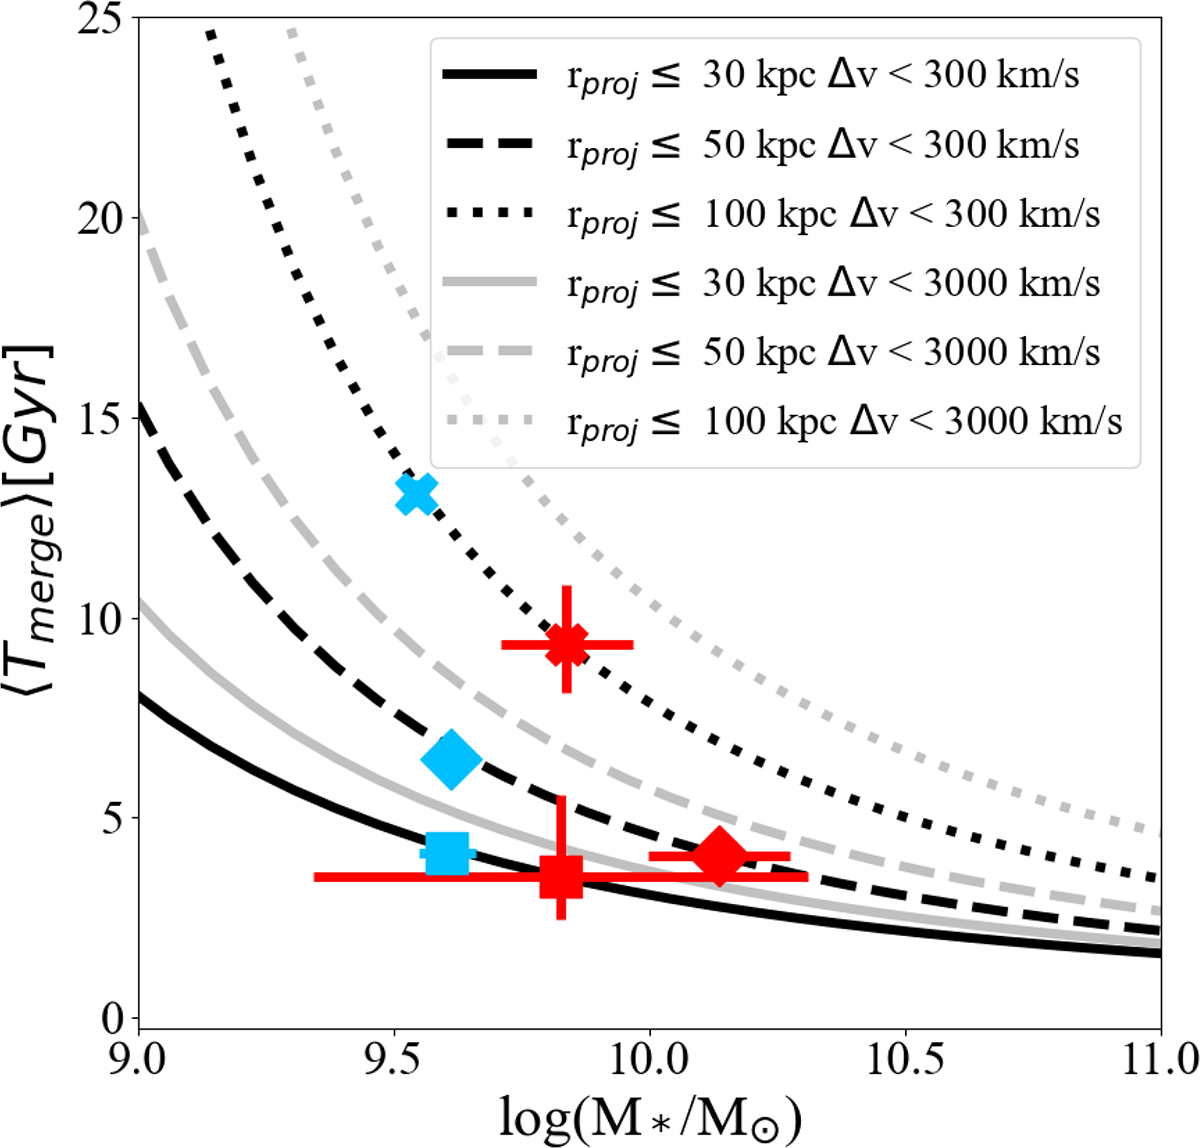
⟨Tmerge⟩ as a function of stellar mass. Contours represent the six different companion selection criteria and corresponding fitting coefficients from Kitzbichler & White (2008). These contours are all plotted at the median redshift of all pairs over all MC iterations (z ∼ 2.48). We also include the calculated ⟨Tmerge⟩ values for Hyperion (red) and the field (blue) at each of projected separation criteria employed (i.e., rproj ≤ 30 kpc (squares), 30 < rproj ≤ 50 kpc (diamonds), and 50 < rproj ≤ 150 kpc (crosses)). The ⟨Tmerge⟩ values calculated for Hyperion are shorter in each bin due to the larger stellar masses of galaxies in Hyperion companion systems.
Current usage metrics show cumulative count of Article Views (full-text article views including HTML views, PDF and ePub downloads, according to the available data) and Abstracts Views on Vision4Press platform.
Data correspond to usage on the plateform after 2015. The current usage metrics is available 48-96 hours after online publication and is updated daily on week days.
Initial download of the metrics may take a while.