Fig. 2.
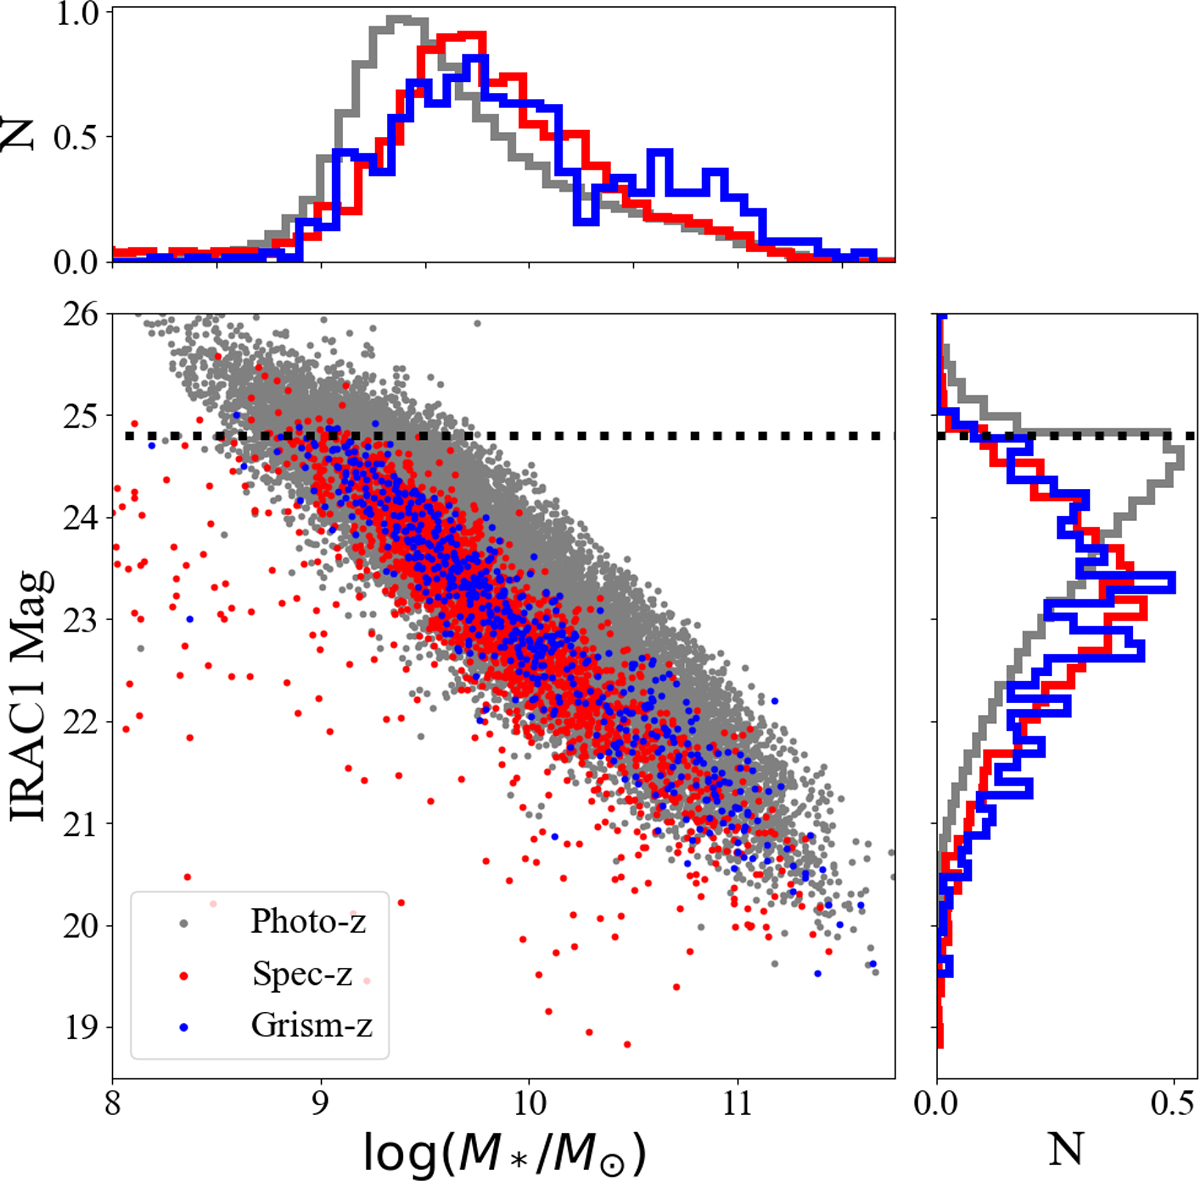
Download original image
Galaxies in our final sample from 2 < z < 3 plotted in stellar mass and IRAC ch1 magnitude space (lower left) along with individual normalized histograms of stellar mass (top) and IRAC ch1 magnitude (lower right). All values are drawn from COSMOS2020 aside from the redshifts where we employ the best spectroscopic or grism redshift when available. For reference, our imposed IRAC ch1 magnitude cut is plotted as the dotted black line (note: some galaxies in our final sample lie above this line as our IRAC cut is an or cut on both ch1 and ch2). As expected, our spectroscopic and grism redshift sources (spec-z and grism-z, respectively) are primarily at brighter magnitudes and higher stellar masses in comparison to the distribution of photometric redshift only sources. Our final sample has a rough stellar mass limit of log(M*/M⊙)∼9.3 from 2 < z < 3 based on our imposed IRAC cuts.
Current usage metrics show cumulative count of Article Views (full-text article views including HTML views, PDF and ePub downloads, according to the available data) and Abstracts Views on Vision4Press platform.
Data correspond to usage on the plateform after 2015. The current usage metrics is available 48-96 hours after online publication and is updated daily on week days.
Initial download of the metrics may take a while.