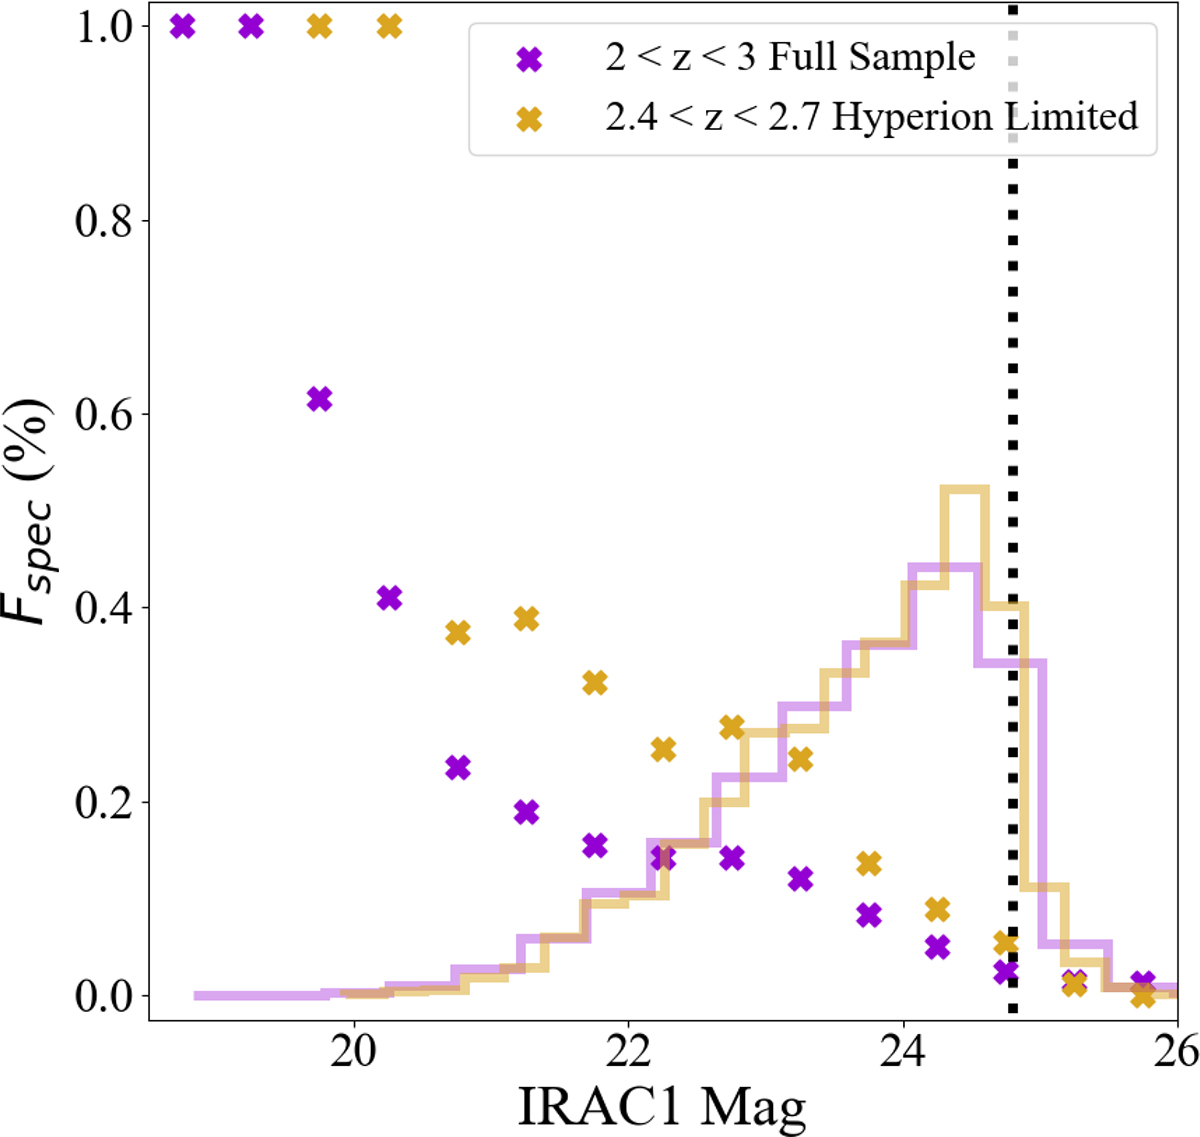
Fig. 3.
Download original image
Spectroscopic completeness (or the fraction of sources with a spectroscopic and/or grism redshift, Fspec) as a function of IRAC ch1 magnitude for all sources from 2 < z < 3 in our final sample (purple) and a sub-sample of sources limited to the redshift range of Hyperion with tighter astrometric cuts (gold). Also included for reference are the underlying normalized IRAC ch1 magnitude distributions for each population along with the location of the imposed IRAC ch1 (or ch2) magnitude cut (vertical dashed black line). Spectroscopic completeness for both samples declines sharply as a function of magnitude. However, there is notably higher completeness for galaxies limited more closely to the bounds of Hyperion.
Current usage metrics show cumulative count of Article Views (full-text article views including HTML views, PDF and ePub downloads, according to the available data) and Abstracts Views on Vision4Press platform.
Data correspond to usage on the plateform after 2015. The current usage metrics is available 48-96 hours after online publication and is updated daily on week days.
Initial download of the metrics may take a while.