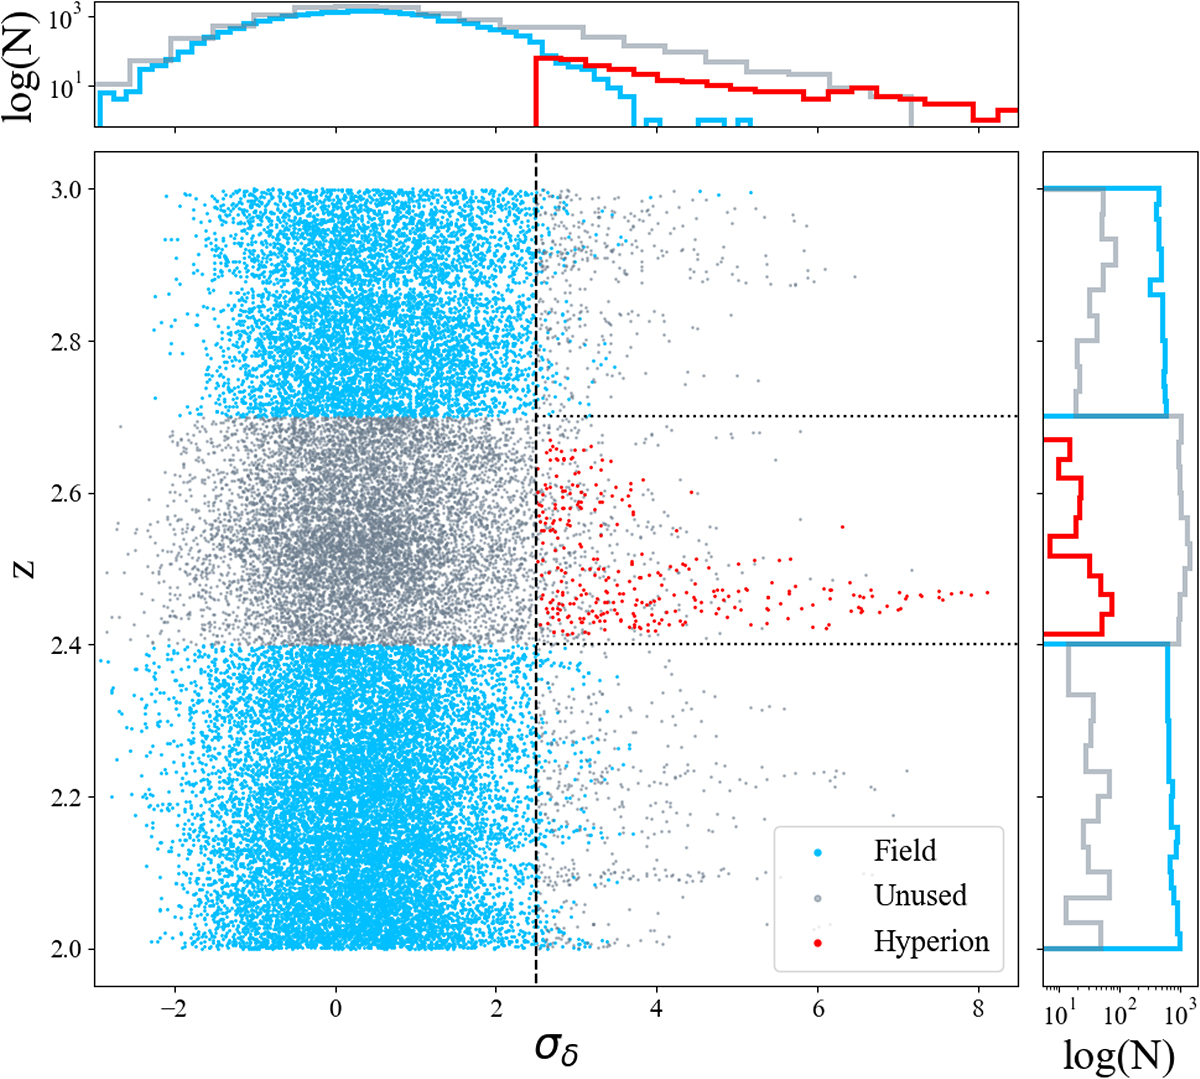
Fig. 4.
Download original image
Example of the distribution of galaxies in redshift and overdensity (σδ) space for one MC iteration used in this work (MC #82). Included are only those galaxies in the relevant redshift range for our fraction calculations (i.e., 2 < z < 3). Galaxies associated with Hyperion for this iteration are marked in red and field galaxies for this iteration are marked in blue. Unused galaxies for this iteration are marked in gray (which includes galaxies in the redshift range of Hyperion that are not associated with overdensity and galaxies in the field sample redshift range that are associated with other large structure, see Section 3.3.2).
Current usage metrics show cumulative count of Article Views (full-text article views including HTML views, PDF and ePub downloads, according to the available data) and Abstracts Views on Vision4Press platform.
Data correspond to usage on the plateform after 2015. The current usage metrics is available 48-96 hours after online publication and is updated daily on week days.
Initial download of the metrics may take a while.