Fig. 6.
Download original image
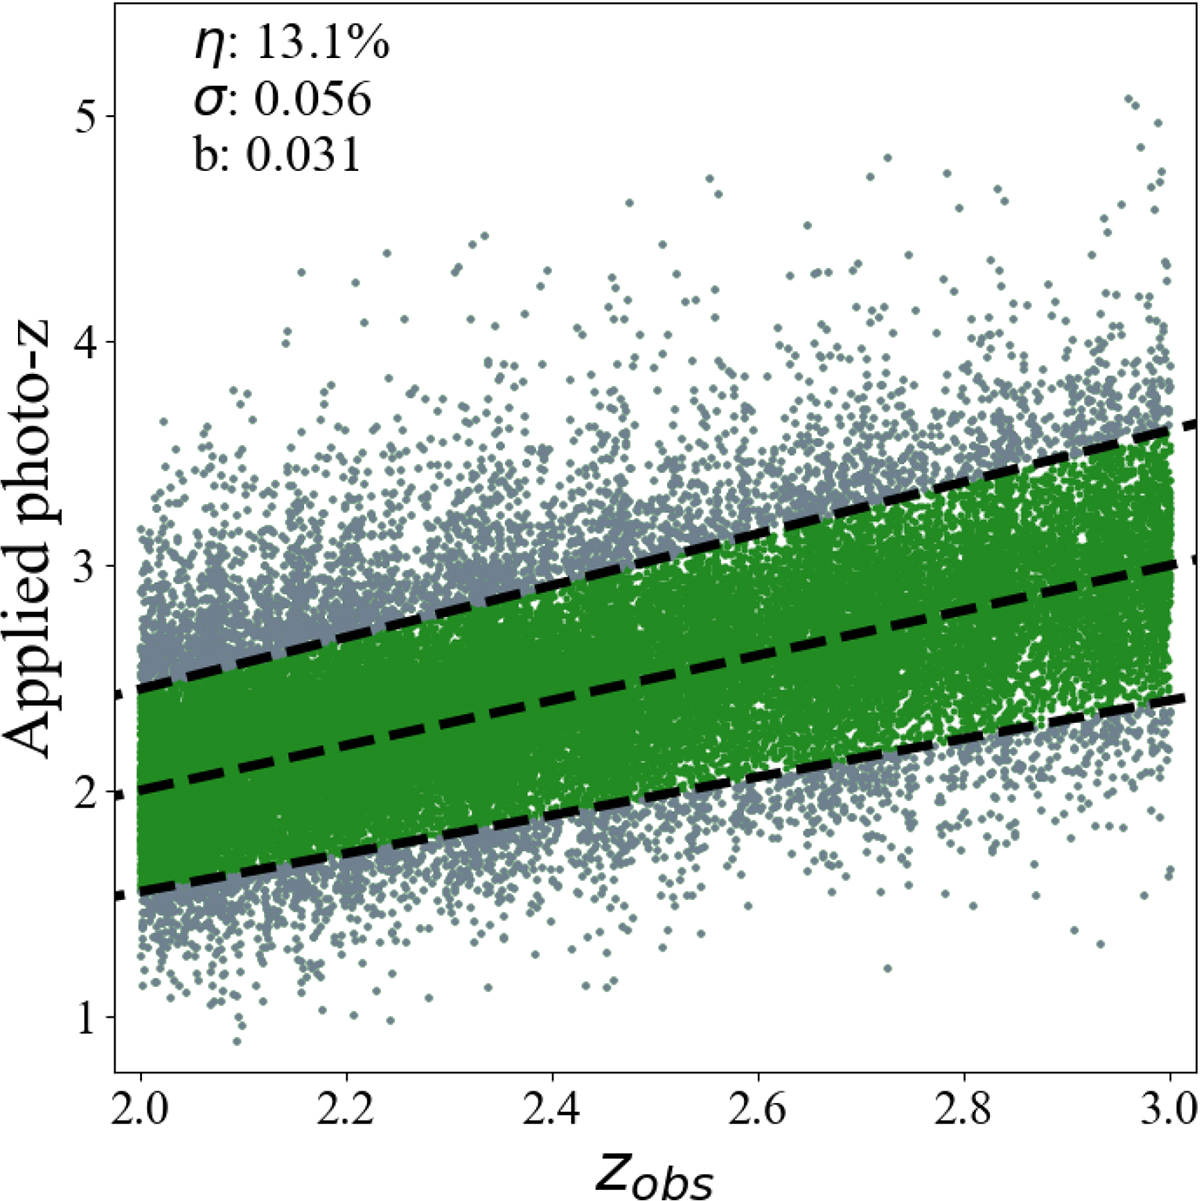
Applied photometric redshifts (photo-zs) versus true simulation redshifts (zobs) for all galaxies in the Mock1 region of the simulated lightcone between 2 < zobs < 3. Galaxies that meet |Δz|< 0.15(1 + zobs) are marked in green (Hildebrandt et al. 2012). The statistics for these galaxies are listed in the upper right hand corner (outlier fraction, scatter, and bias, respectively). Photo-zs are applied to all galaxies in our simulated lightcone based on the observed photo-z statistics in COSMOS2020 as a function of magnitude and redshift. The scatter in photo-zs creates difficulty in recovering companion systems (see Section 3.4.1).
Current usage metrics show cumulative count of Article Views (full-text article views including HTML views, PDF and ePub downloads, according to the available data) and Abstracts Views on Vision4Press platform.
Data correspond to usage on the plateform after 2015. The current usage metrics is available 48-96 hours after online publication and is updated daily on week days.
Initial download of the metrics may take a while.