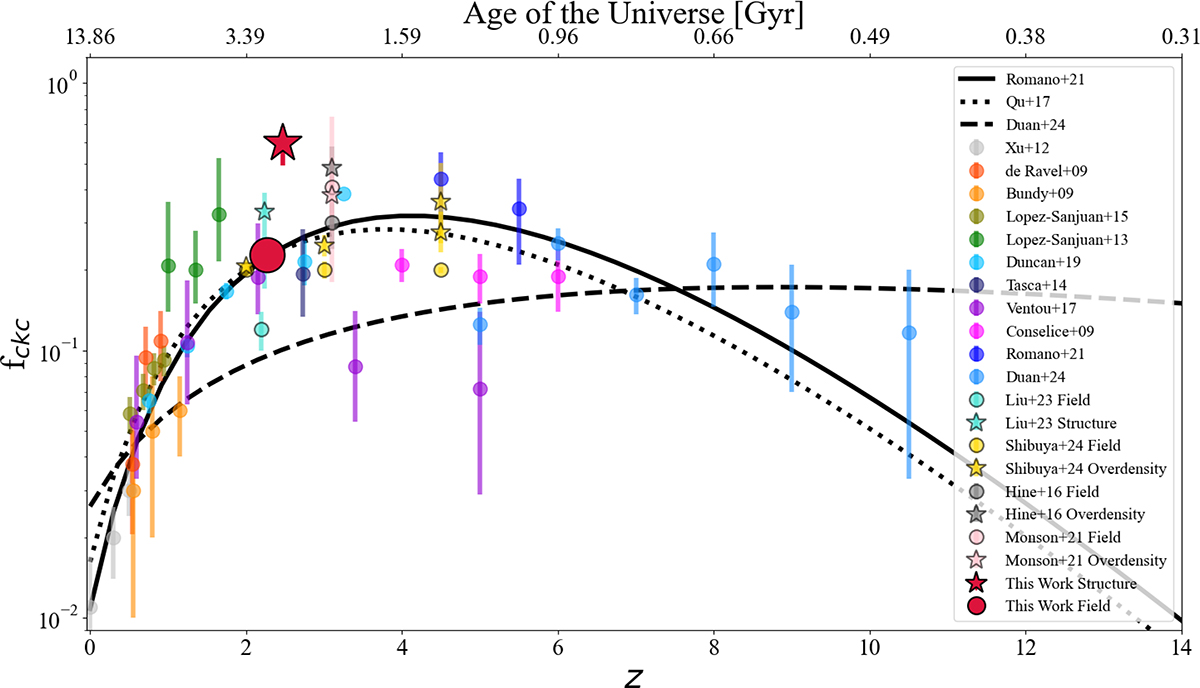
Fig. 9.
Download original image
Evolution of fckc and fckc-like measurements as a function of redshift. The values measured in this work are plotted in red with black borders with the star denoting our structure measurement and the circle denoting our field measurement. Other studies that examine merger and interaction rates in relation to overdensity or structure at relevant epochs have their results plotted similarly (i.e., structure or overdensity fraction as a star and field fraction as a circle, Hine et al. 2016; Monson et al. 2021; Liu et al. 2023; Shibuya et al. 2025) Various values from the literature that measure relevant major merger and pair fractions are also plotted for reference (Bundy et al. 2009; Conselice et al. 2009; de Ravel et al. 2009; Xu et al. 2012; López-Sanjuan et al. 2013; Tasca et al. 2014; López-Sanjuan et al. 2015; Ventou et al. 2017; Duncan et al. 2019; Romano et al. 2021; Duan et al. 2025), along with simulation predictions from Qu et al. (2017) and empirical fits from Romano et al. (2021) and Duan et al. (2025). Overall, we find that fckc evolves sharply at low redshift before peaking at z ∼ 4 with the measured fckc for Hyperion, though at lower redshift (z ∼ 2.5), existing above the peak value. Though some scatter exists, the existing measured merger and interaction rates for structures and overdensities are higher than the corresponding field rates at similar redshifts.
Current usage metrics show cumulative count of Article Views (full-text article views including HTML views, PDF and ePub downloads, according to the available data) and Abstracts Views on Vision4Press platform.
Data correspond to usage on the plateform after 2015. The current usage metrics is available 48-96 hours after online publication and is updated daily on week days.
Initial download of the metrics may take a while.