Fig. 1
Download original image
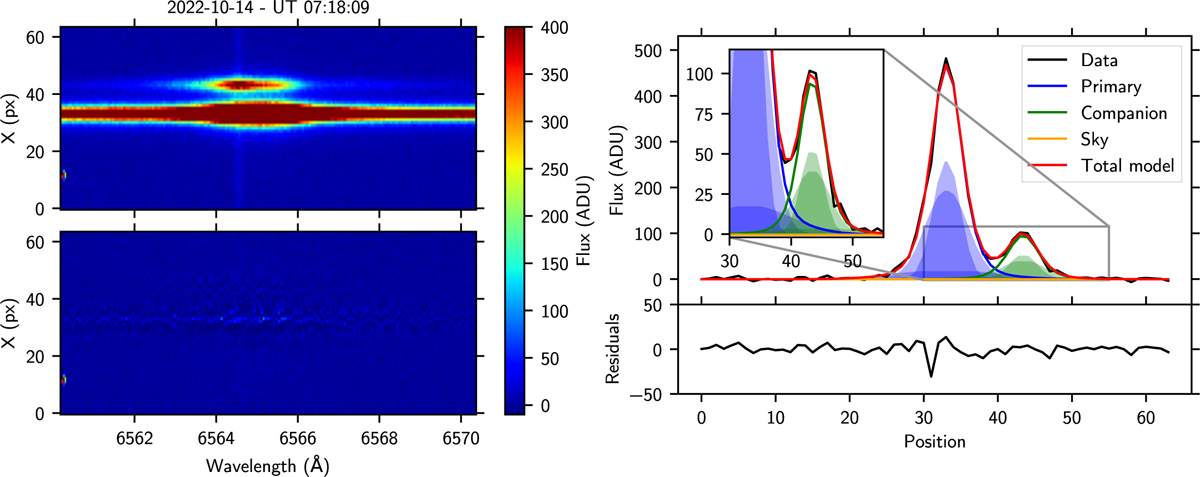
Illustration of the extraction process for one of the exposures in the RED arm. Left: 2D reconstructed slit, before (top) and after (bottom) subtraction of the PSF models for both the primary and the companion. Right: illustration of the extraction process at a single wavelength bin within Hα. The blue- and green-shaded regions are the various Gaussian components used in the PSF fitting process for the primary and companion, respectively (three Gaussian components here for the RED arm). Bottom panels: modeling residuals.
Current usage metrics show cumulative count of Article Views (full-text article views including HTML views, PDF and ePub downloads, according to the available data) and Abstracts Views on Vision4Press platform.
Data correspond to usage on the plateform after 2015. The current usage metrics is available 48-96 hours after online publication and is updated daily on week days.
Initial download of the metrics may take a while.