Fig. 10
Download original image
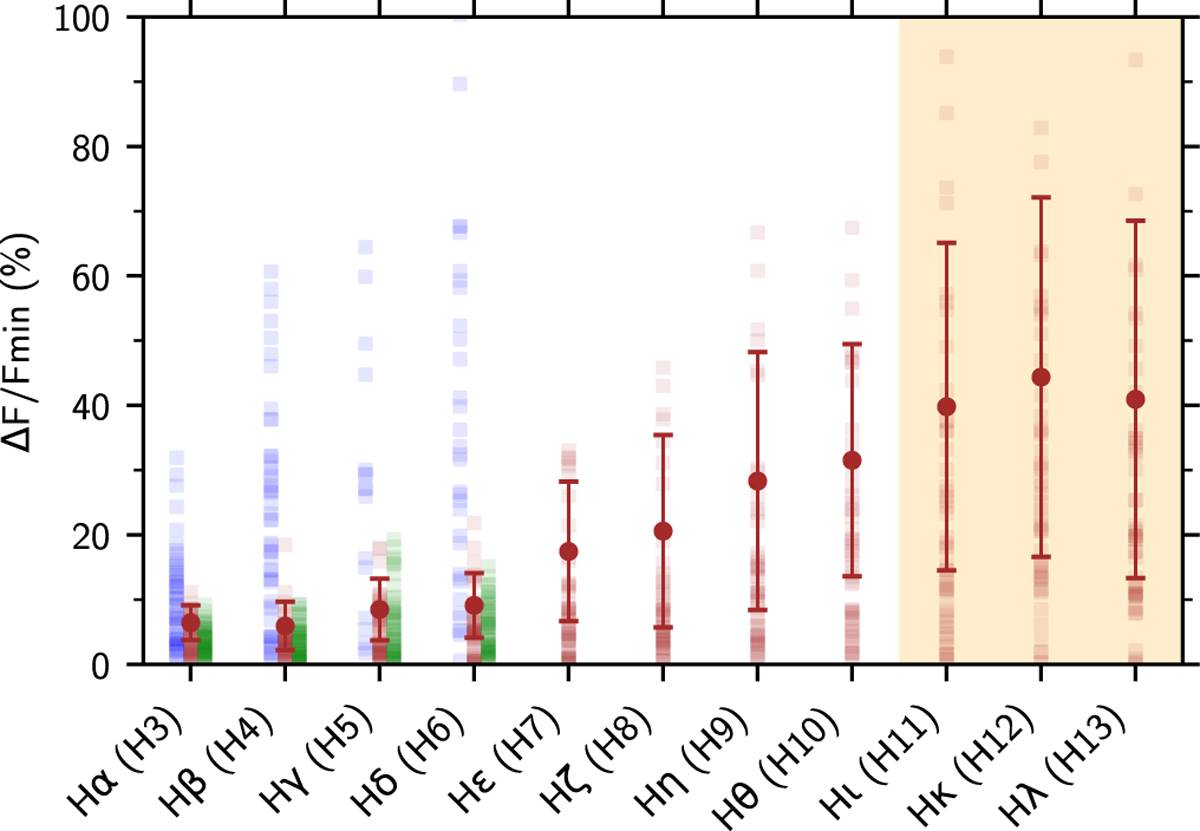
Variability of the Balmer lines at the hourly timescale. The color of the points represents the component (blue for wings and green for core) or the full line (brown). Error bars represent the spread of the variability (weighted by significance), i.e., the brown crosses in Fig. 9. The shaded region corresponds to lines where the detection is compatible with contamination from the host binary. The hourly timescale variability seems to increase with the order of the transition. The wing component has a much higher variability amplitude than the green component.
Current usage metrics show cumulative count of Article Views (full-text article views including HTML views, PDF and ePub downloads, according to the available data) and Abstracts Views on Vision4Press platform.
Data correspond to usage on the plateform after 2015. The current usage metrics is available 48-96 hours after online publication and is updated daily on week days.
Initial download of the metrics may take a while.