Fig. 11
Download original image
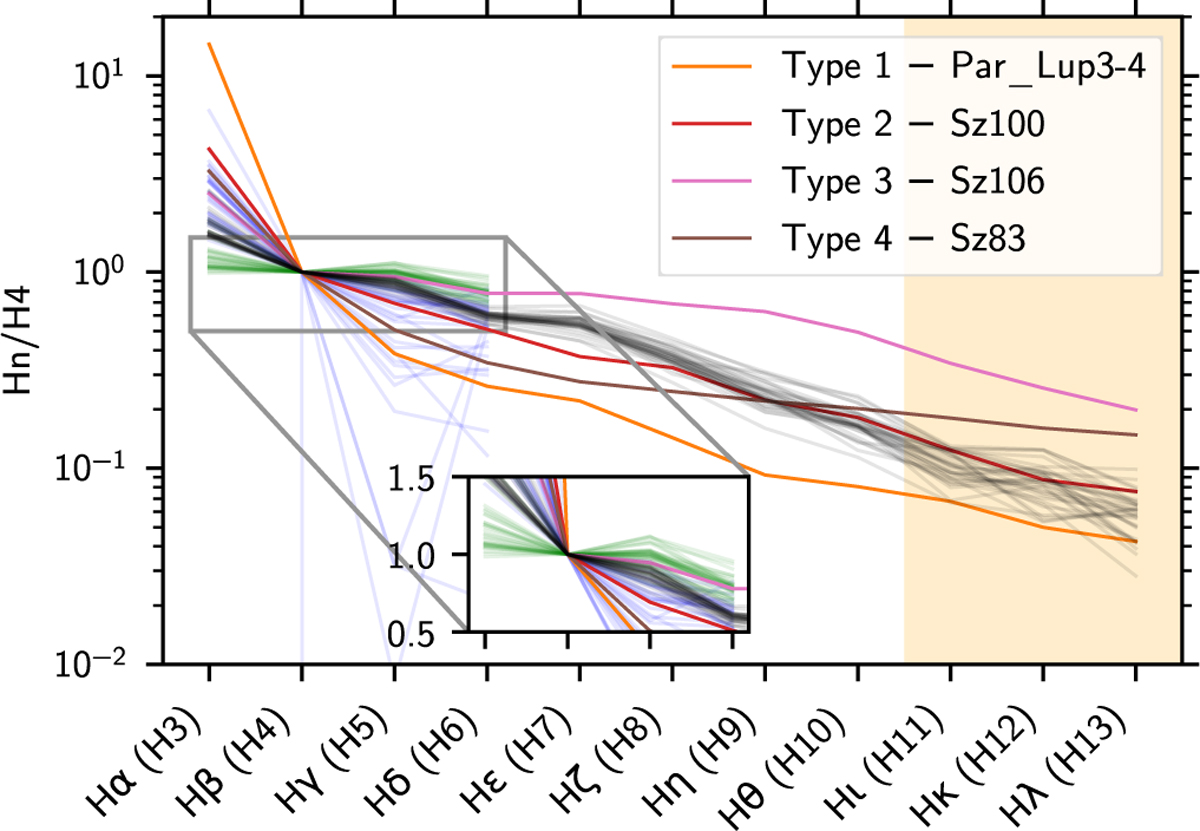
Line ratios decrements. For each line, the line ratio is computed with respect to Hβ (H4). In black, the line ratios of the full-lines in this study are shown. Colored lines correspond to the four decrement types identified in Antoniucci et al. (2017) (see their Fig. 3). Blue and green lines represent the subcomponents (wing and core) obtained in Sect. 4.5. The shaded region corresponds to the lines, which may result from contamination from the host binary (as in Fig. 10). The full-line decrement (black) is broadly compatible with Type 2 case (optically thin emission and low accretion rate). The wing component is not clearly compatible with any decrement type. However, the core component is compatible with the Type 3 sources, which are not easily reproduced by emission line models (Antoniucci et al. 2017).
Current usage metrics show cumulative count of Article Views (full-text article views including HTML views, PDF and ePub downloads, according to the available data) and Abstracts Views on Vision4Press platform.
Data correspond to usage on the plateform after 2015. The current usage metrics is available 48-96 hours after online publication and is updated daily on week days.
Initial download of the metrics may take a while.