Fig. 12
Download original image
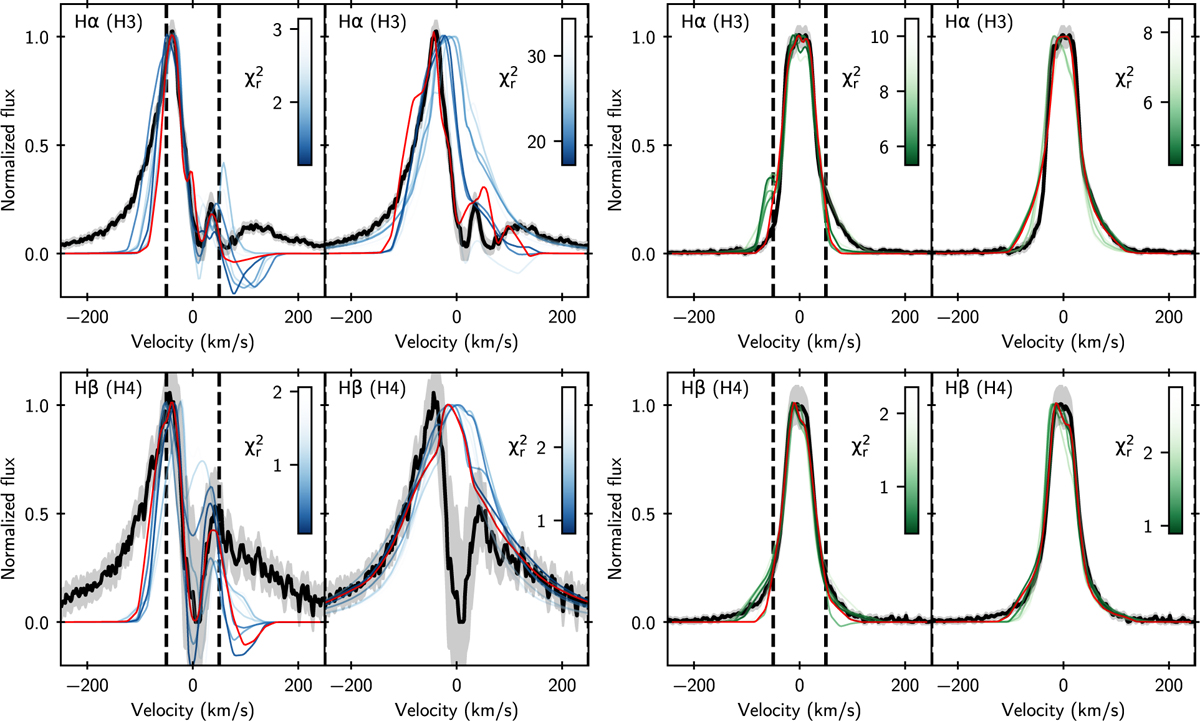
Modeling results for the magnetospheric accretion models (Thanathibodee et al. 2019a). Left: results for the wing subcomponent. Right: results for the core subcomponent. First row: Hα. Second row: Hβ. Each left subpanel corresponds to the fit performed on the [−50; +50] km/s range, while the right subpanels correspond to the fit on the full the line width ([−250; +250] km/s). The red line is the best model, while the colored lines represent a sample of the lowest ![]() models. The models are able to reproduce the deep absorption features of the wing component and reproduce the general shape of the core component.
models. The models are able to reproduce the deep absorption features of the wing component and reproduce the general shape of the core component.
Current usage metrics show cumulative count of Article Views (full-text article views including HTML views, PDF and ePub downloads, according to the available data) and Abstracts Views on Vision4Press platform.
Data correspond to usage on the plateform after 2015. The current usage metrics is available 48-96 hours after online publication and is updated daily on week days.
Initial download of the metrics may take a while.