Fig. 13
Download original image
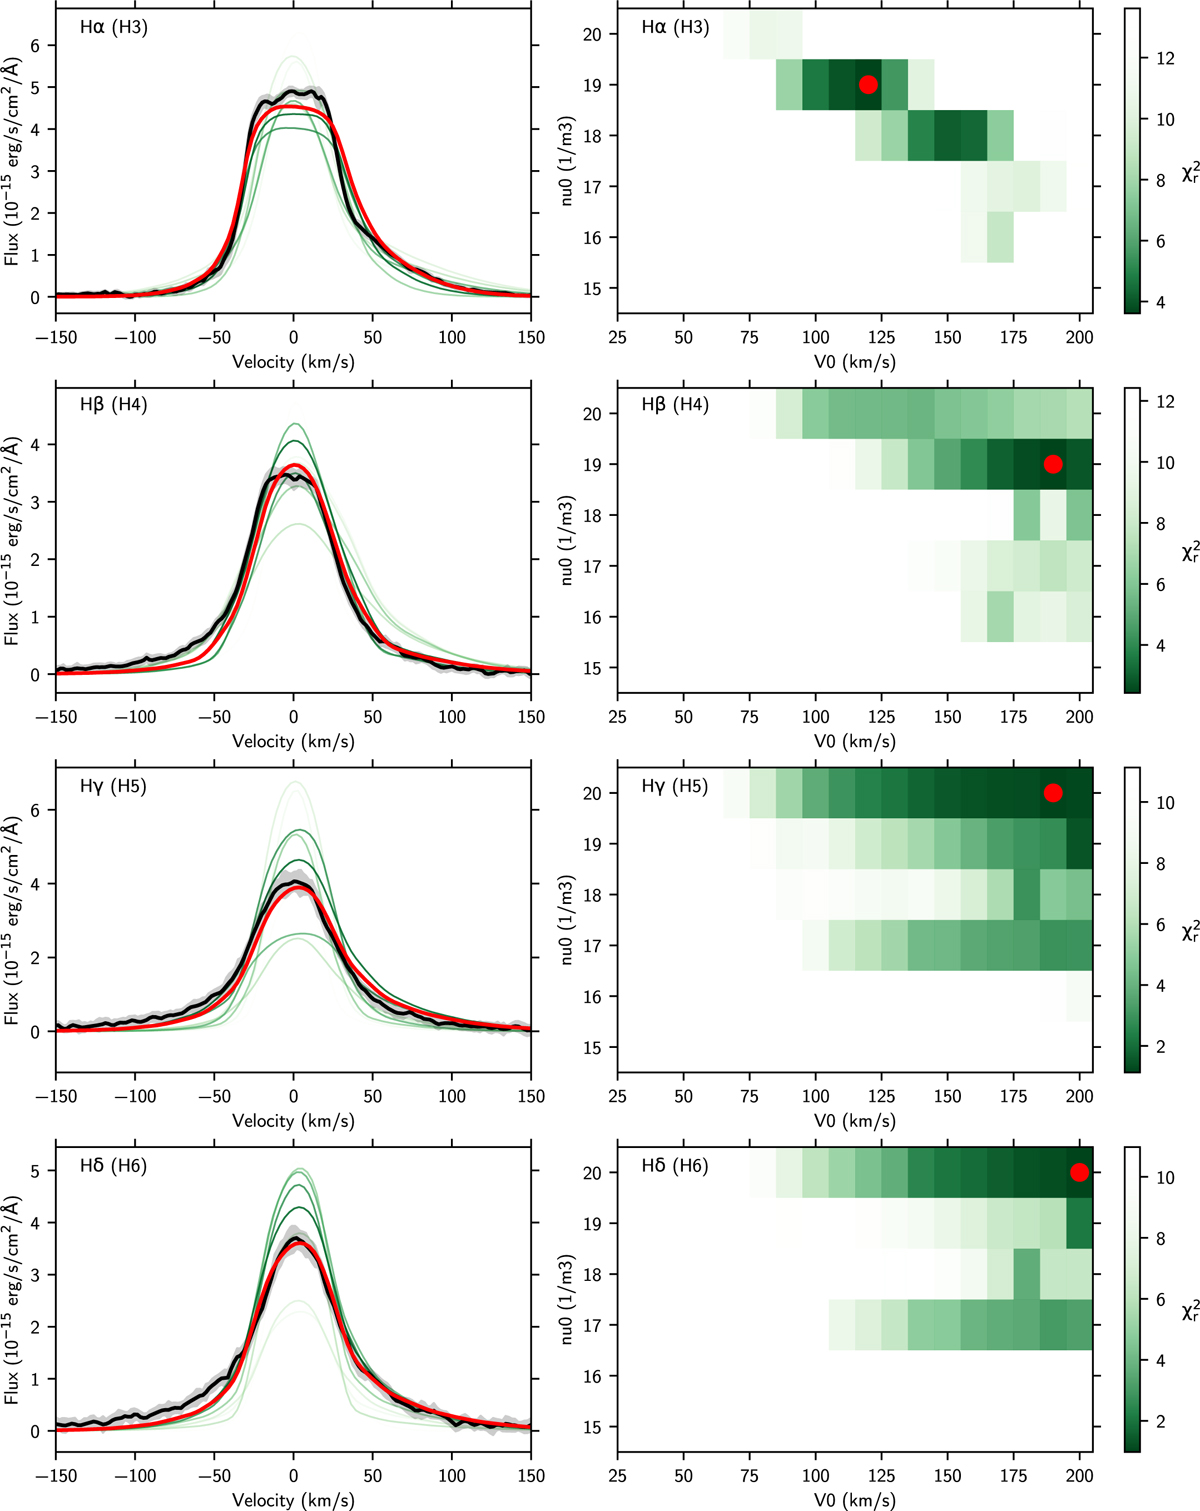
Modeling results for the shock models (Aoyama et al. 2018), with the flux scaling corresponding to epoch 2022-10-14 – 06:52:50). On each row, the left panel shows the core component for that line (black line), a sample of the best fits (green lines) and the best fit (red line). Right panel: corresponding ![]() map. The models provide an increasingly good fit as the order of the line-transition increases. The shift between data and models for Hβ and Hγ is likely due to the lower accuracy on the reference wavelength for these two lines in NIST.
map. The models provide an increasingly good fit as the order of the line-transition increases. The shift between data and models for Hβ and Hγ is likely due to the lower accuracy on the reference wavelength for these two lines in NIST.
Current usage metrics show cumulative count of Article Views (full-text article views including HTML views, PDF and ePub downloads, according to the available data) and Abstracts Views on Vision4Press platform.
Data correspond to usage on the plateform after 2015. The current usage metrics is available 48-96 hours after online publication and is updated daily on week days.
Initial download of the metrics may take a while.