Fig. 15
Download original image
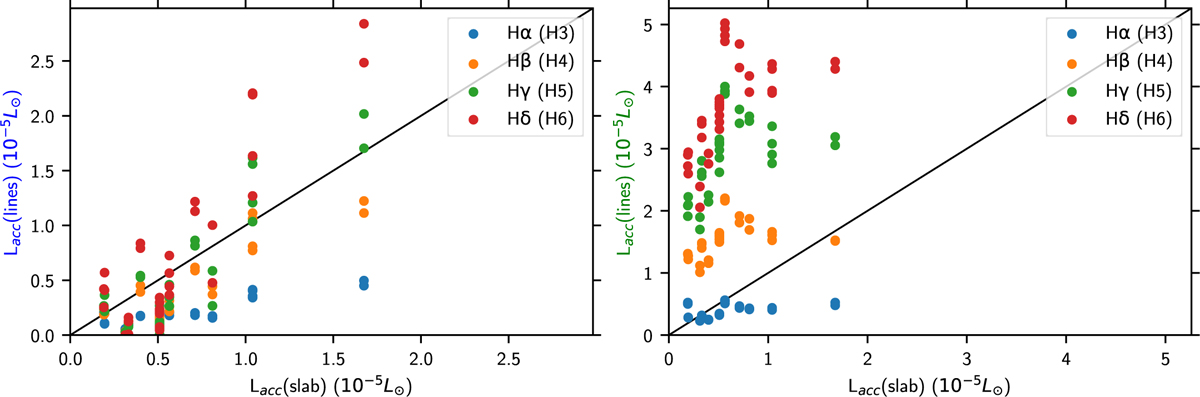
Correlations between the accretion luminosity (Lacc) obtained from the UV excess fitting (slab-modeling) and the wing (left) and core (right) components fluxes (Alcalá et al. 2017). The black line shows the Y = X curve. The average accretion luminosity derived from the wing components of various lines is correlated with the accretion luminosity derived from that of slab-modeling (Sect. 5.3), while the accretion luminosity derived from the core component is well above it.
Current usage metrics show cumulative count of Article Views (full-text article views including HTML views, PDF and ePub downloads, according to the available data) and Abstracts Views on Vision4Press platform.
Data correspond to usage on the plateform after 2015. The current usage metrics is available 48-96 hours after online publication and is updated daily on week days.
Initial download of the metrics may take a while.