Fig. 16
Download original image
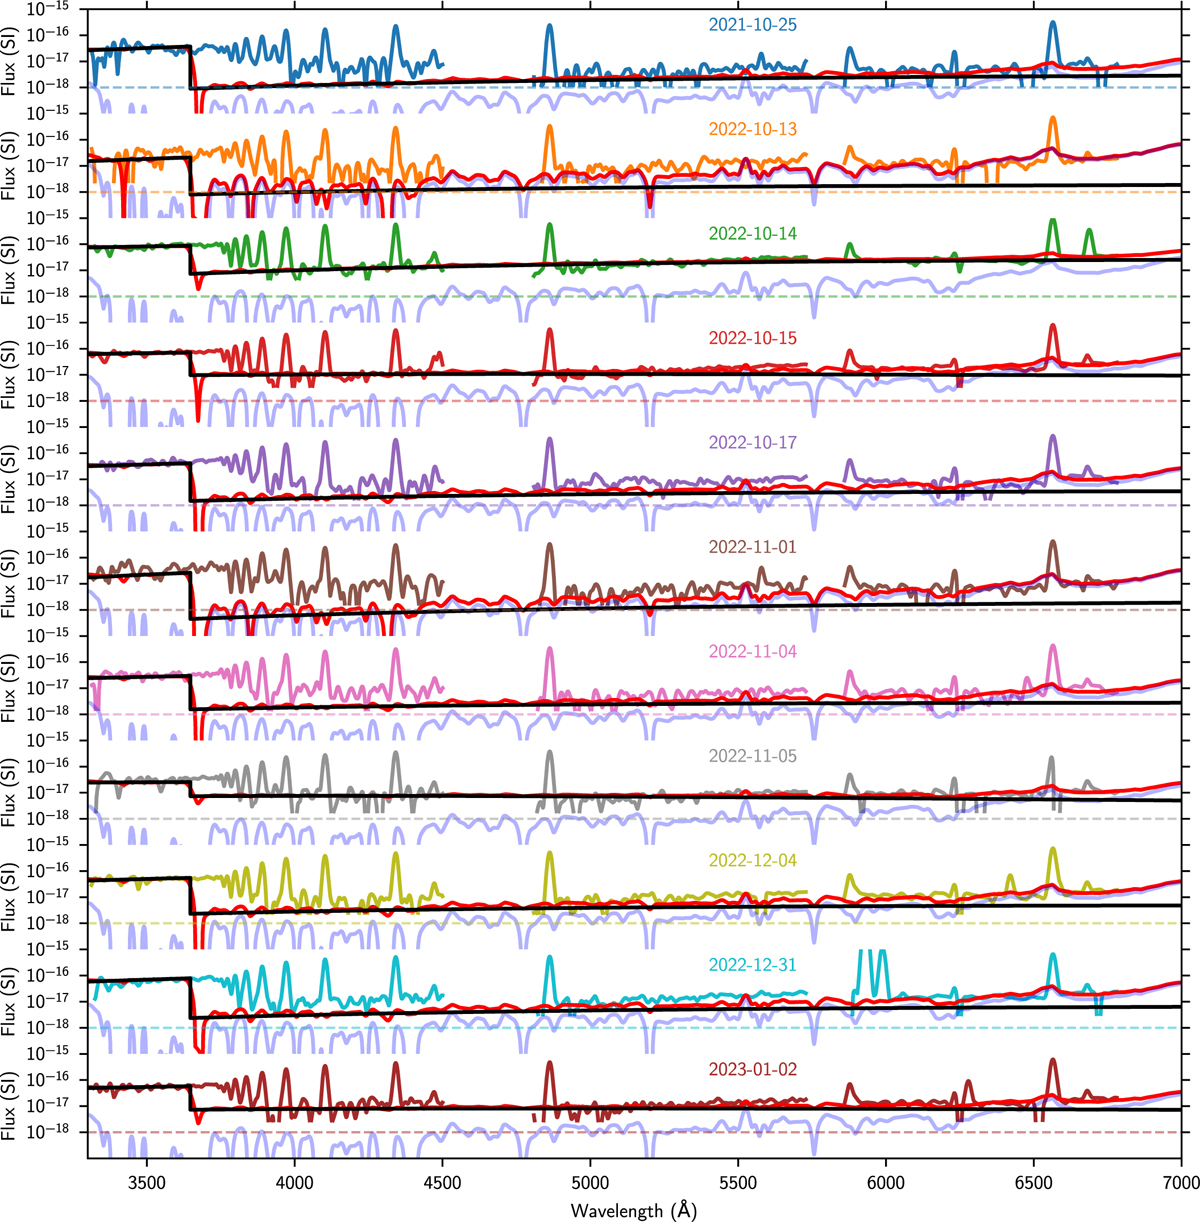
Best-fit results to the UV excess and general continuum level using the slab models. The colored lines represent the individual mean epochs. The best fit components are shown for the UV excess (black, slab), photospheric template (light blue, class III), and total model (red). The data were smoothed to R ∼ 250; points below 20% the median level are masked; and a dashed line at 10−18 erg/s/cm2/Å is plotted at each epoch. All spectra are given in erg/s/cm2/Å units. The modeling provides a good fit to the UV excess and shows that almost all epochs have their continuum dominated by the shock-component extending to higher wavelengths. This is particularly evident in outburst epochs (2022-10-14/15).
Current usage metrics show cumulative count of Article Views (full-text article views including HTML views, PDF and ePub downloads, according to the available data) and Abstracts Views on Vision4Press platform.
Data correspond to usage on the plateform after 2015. The current usage metrics is available 48-96 hours after online publication and is updated daily on week days.
Initial download of the metrics may take a while.