Fig. 2
Download original image
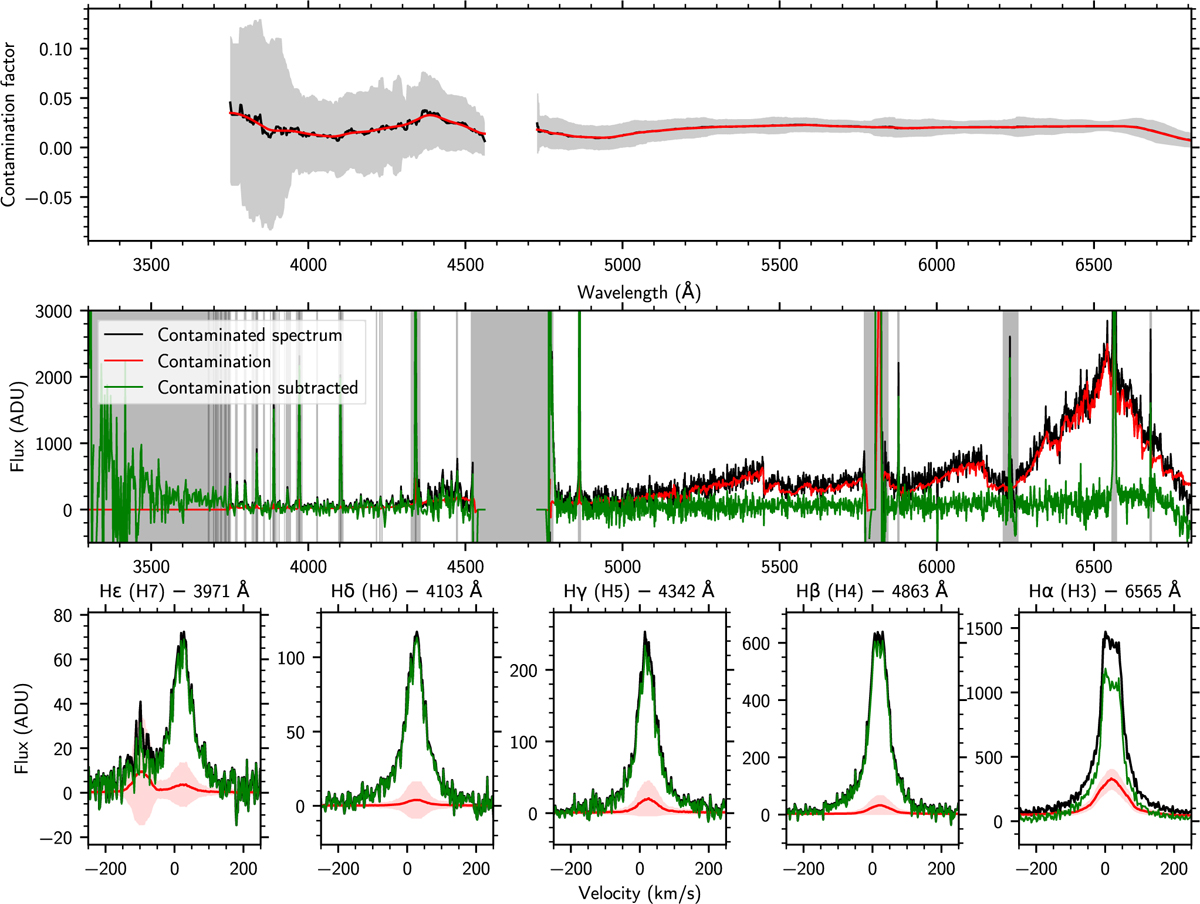
Illustration of the residual contamination correction for the exposure 2022-11-05 UT 01:22:25. This corresponds to the case with the highest contamination. Top panel: residual contamination factor (black) smoothed with a 10 px wide-moving Gaussian box (red) and its associated error bars (black-shaded region). Middle panel: companion spectrum as the output of the extraction process (black) with the contamination contribution (red) and the contamination-corrected companion spectrum (green). All black-shaded regions were excluded from the fit; they correspond to emission lines and detector edges. Third row: contamination contribution within emission lines (same colors). The contamination removal process is able to remove most of the residual primary flux in the companion spectrum, which accounts for ∼10% of the lines flux depending on the exposure.
Current usage metrics show cumulative count of Article Views (full-text article views including HTML views, PDF and ePub downloads, according to the available data) and Abstracts Views on Vision4Press platform.
Data correspond to usage on the plateform after 2015. The current usage metrics is available 48-96 hours after online publication and is updated daily on week days.
Initial download of the metrics may take a while.