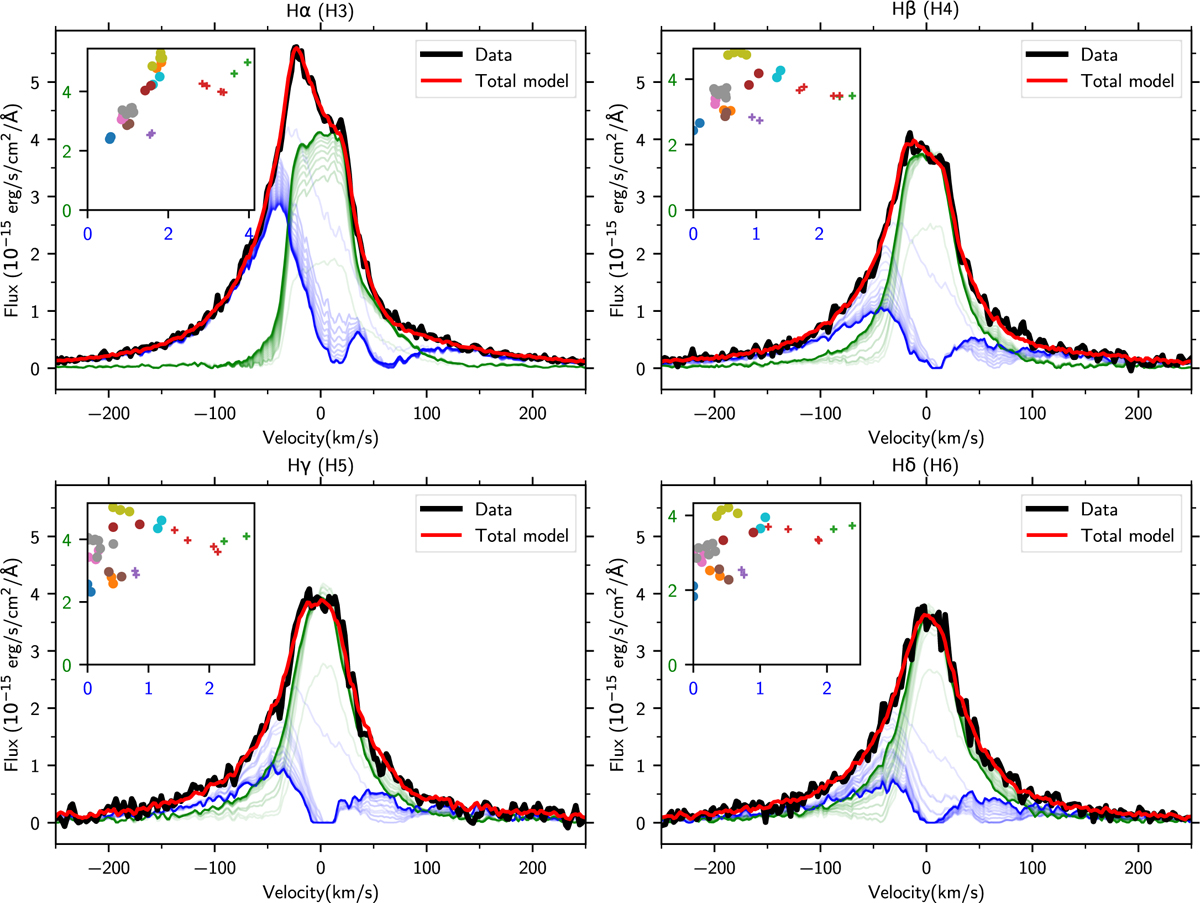
Fig. D.1
Download original image
wing and core component decomposition of the Hα, Hβ, Hγ, and Hδ lines for epoch 2022-10-15-06:30:49 (black). The blue-green shaded lines correspond to successive iterations of the decomposition. The solid blue and green lines correspond to the final iteration. The red line represents the total model at the last iteration. The inset corresponds to the scaling factor of each of the wing and core components, depending on the epoch. The points are color-coded for each epoch, as in Fig. 4. The crosses correspond to the outburst epochs.
Current usage metrics show cumulative count of Article Views (full-text article views including HTML views, PDF and ePub downloads, according to the available data) and Abstracts Views on Vision4Press platform.
Data correspond to usage on the plateform after 2015. The current usage metrics is available 48-96 hours after online publication and is updated daily on week days.
Initial download of the metrics may take a while.