Fig. F.1
Download original image
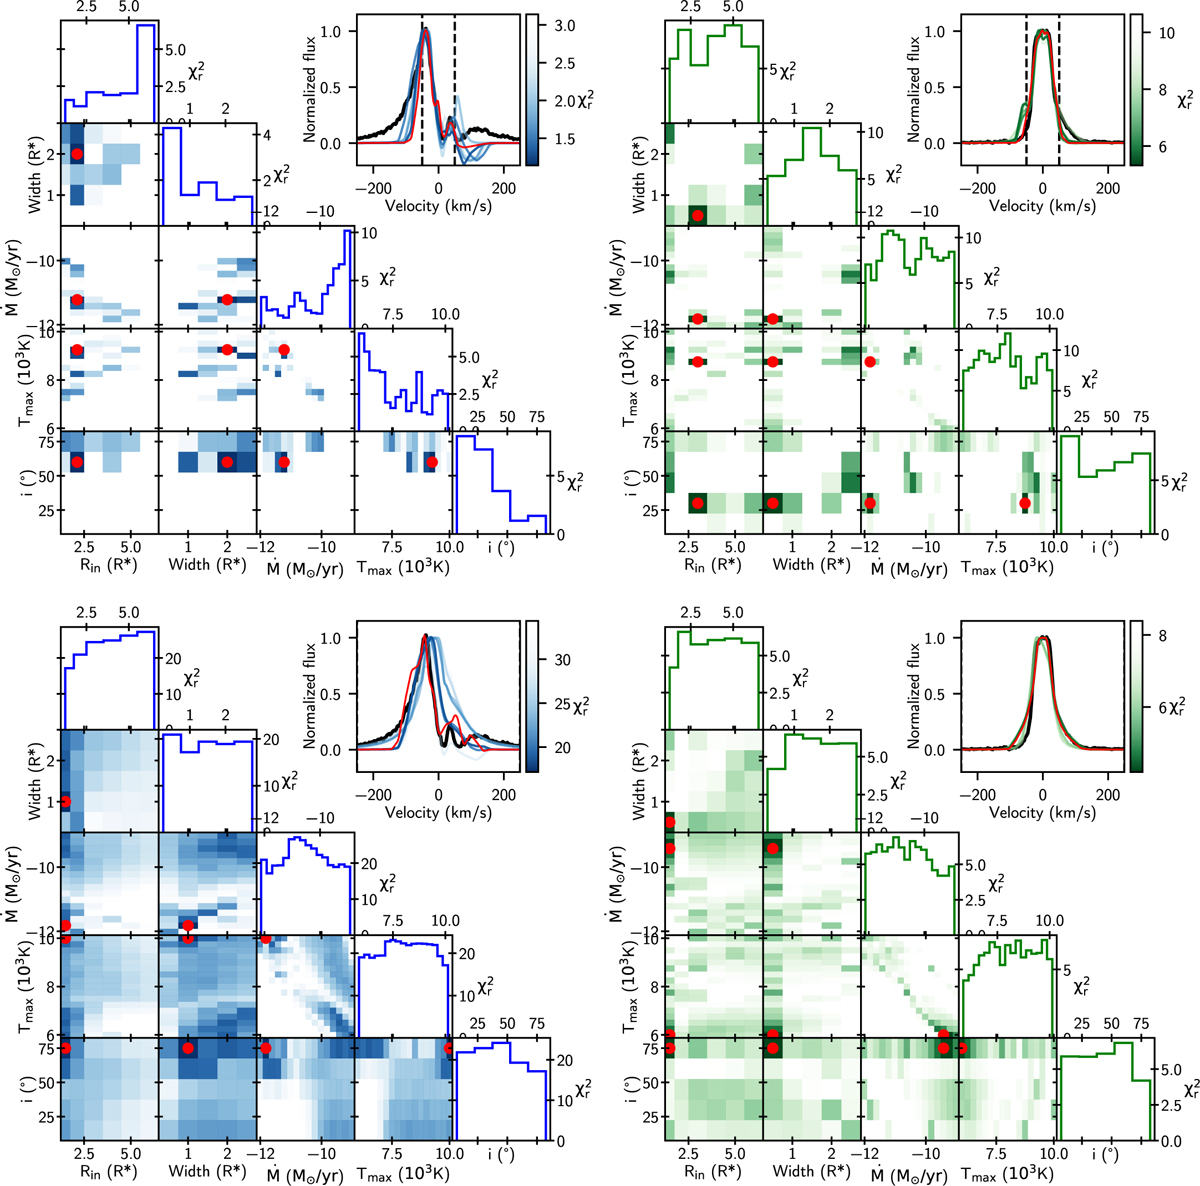
![]() maps for the various combinations of free parameters in the magnetospheric accretion models for the wing (blue, left) and core (green, right) components of the Hα line. Top row: Case when fitting only on the center of the component. Bottom row: Case when fitting the full line. In the insets, the various colored lines represent some of the best models with the corresponding
maps for the various combinations of free parameters in the magnetospheric accretion models for the wing (blue, left) and core (green, right) components of the Hα line. Top row: Case when fitting only on the center of the component. Bottom row: Case when fitting the full line. In the insets, the various colored lines represent some of the best models with the corresponding ![]() shown in the color bar. The red line corresponds to the best model indicated by the red dot in the corner plot.
shown in the color bar. The red line corresponds to the best model indicated by the red dot in the corner plot.
Current usage metrics show cumulative count of Article Views (full-text article views including HTML views, PDF and ePub downloads, according to the available data) and Abstracts Views on Vision4Press platform.
Data correspond to usage on the plateform after 2015. The current usage metrics is available 48-96 hours after online publication and is updated daily on week days.
Initial download of the metrics may take a while.