Fig. 3
Download original image
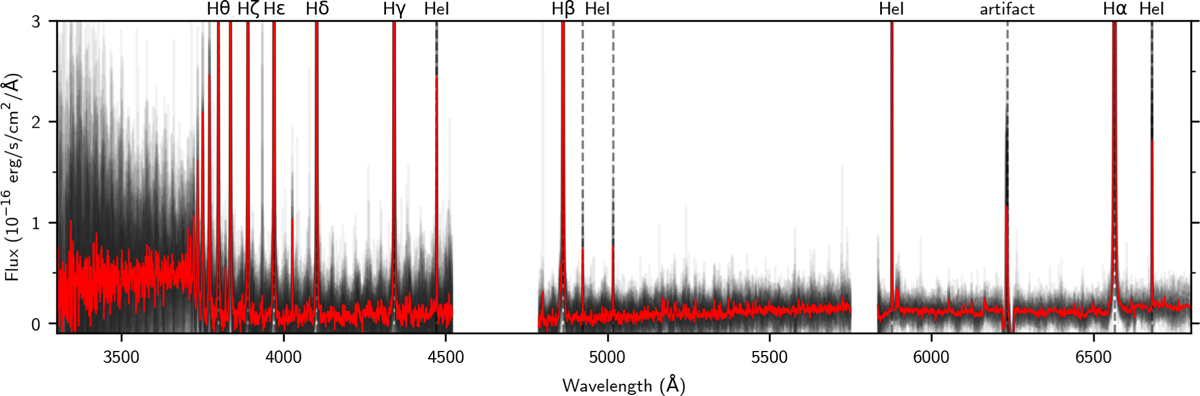
Final spectra over the full spectral range. All Delorme 1 (AB)b spectra, overlaid in black, with the mean spectrum in red. All spectra were smoothed to R = 5000 for clarity. The UV excess of Delorme 1 (AB)b is clearly visible below ∼3700 Å, as well as the generally flat continuum shape. The line marked as an artifact is due to a bad-pixel row on the detector.
Current usage metrics show cumulative count of Article Views (full-text article views including HTML views, PDF and ePub downloads, according to the available data) and Abstracts Views on Vision4Press platform.
Data correspond to usage on the plateform after 2015. The current usage metrics is available 48-96 hours after online publication and is updated daily on week days.
Initial download of the metrics may take a while.