Fig. F.4
Download original image
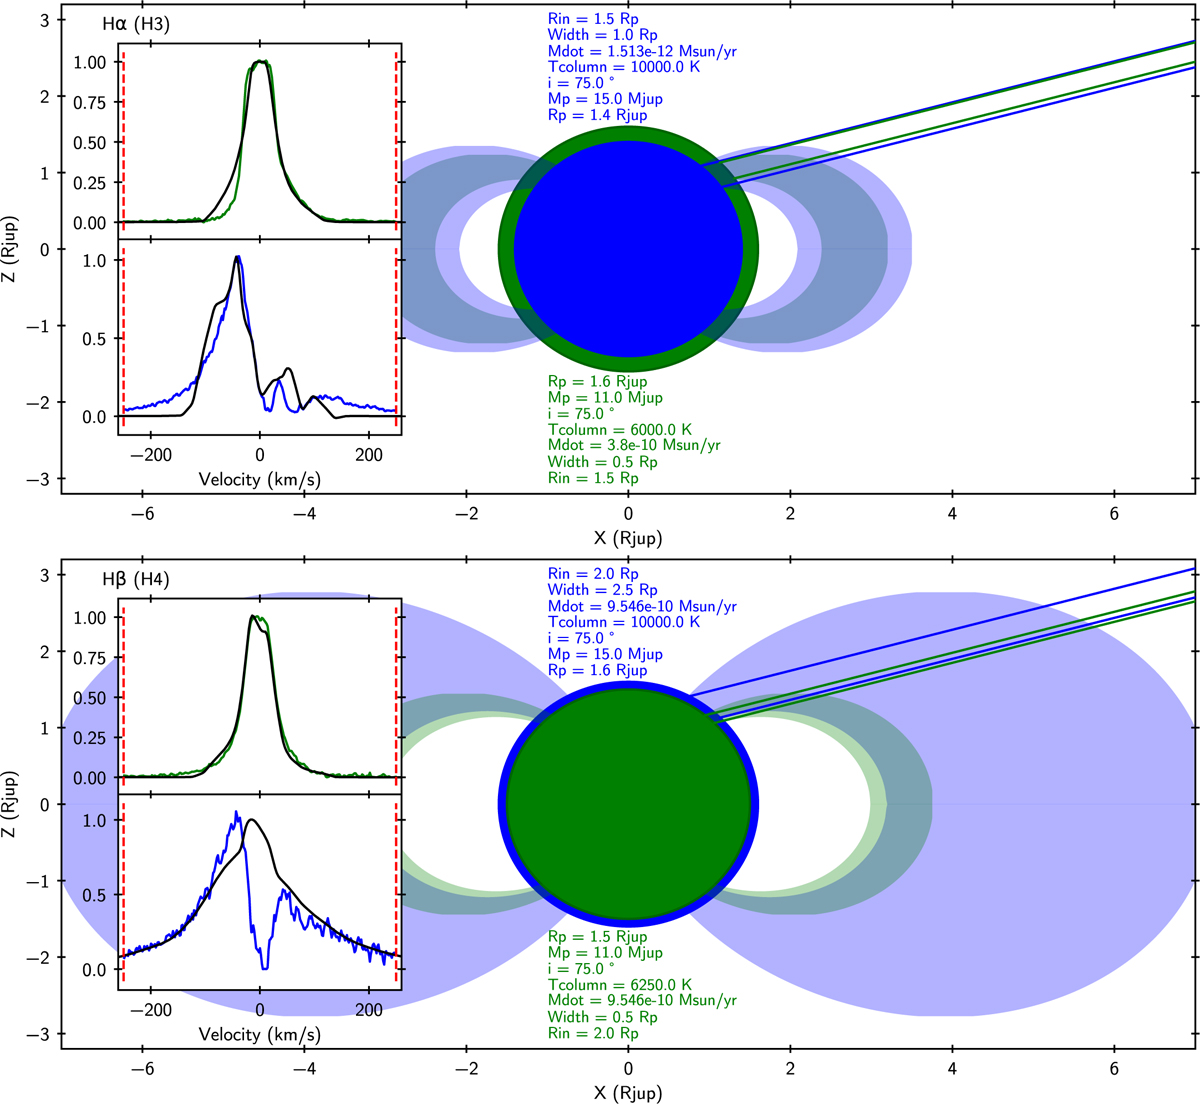
Same as Fig. F.3, but for the full fitting range. Sketch of the best-fit model for the full range of both the wing and the core components of Hα (top) and Hβ (bottom). The blue and green lines in the top right of the image corresponds to the line of sight intercepting the shock. The planet in the center and its “apparent shell” of a different color represent the size of the planet in the wing (blue) and core (green) component modeling. Left insets: Data for the wing and core (blue and green) components and the best-fit (black line), along with the fitting limits (dashed red lines).
Current usage metrics show cumulative count of Article Views (full-text article views including HTML views, PDF and ePub downloads, according to the available data) and Abstracts Views on Vision4Press platform.
Data correspond to usage on the plateform after 2015. The current usage metrics is available 48-96 hours after online publication and is updated daily on week days.
Initial download of the metrics may take a while.