Fig. 6
Download original image
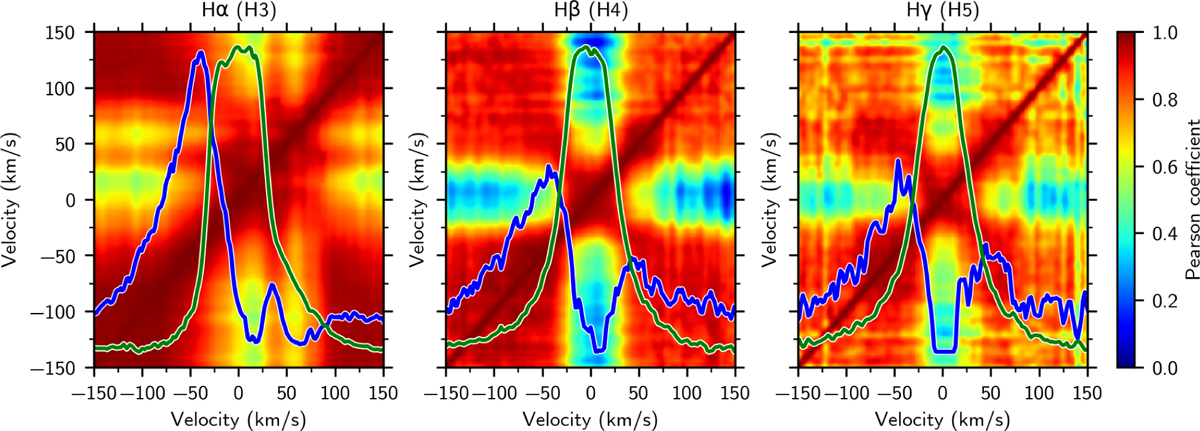
Autocorrelations of the lines Hα, Hβ, and Hγ. The color indicates the value of the Pearson correlation coefficient. The lines were smoothed to R ∼ 40 000 to remove some of the noisy features. The lack of correlation between the wings and the core suggests that the lines may be made of two subcomponents. Overplotted in blue and green are the two subcomponent decompositions obtained in Section 4.5, explaining the features of the autocorrelation. The correlation diagrams for the higher order lines have the same overall shape as Hβ and Hγ.
Current usage metrics show cumulative count of Article Views (full-text article views including HTML views, PDF and ePub downloads, according to the available data) and Abstracts Views on Vision4Press platform.
Data correspond to usage on the plateform after 2015. The current usage metrics is available 48-96 hours after online publication and is updated daily on week days.
Initial download of the metrics may take a while.