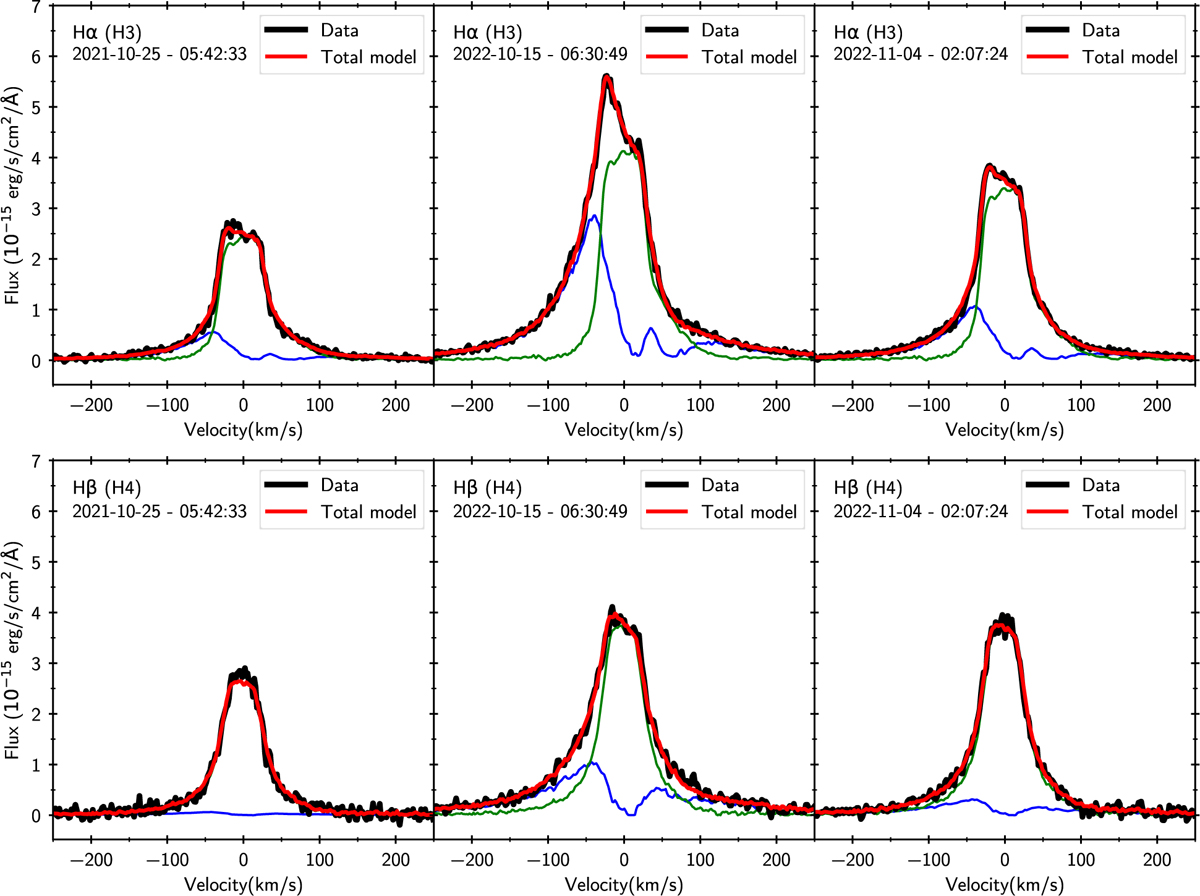
Fig. 7
Download original image
Illustration of the decomposition for three different exposures for Hα (first row) and Hβ (second row). The two components are shown in blue and green, the total model in red, and the corresponding data in black. The decompositions for all exposures are shown in Figs. C.1, C.2, C.3 and C.4 for Hα, Hβ, Hγ, and Hδ, respectively. This decomposition provides a great fit to all exposures despite the strong constraint of a constant profile.
Current usage metrics show cumulative count of Article Views (full-text article views including HTML views, PDF and ePub downloads, according to the available data) and Abstracts Views on Vision4Press platform.
Data correspond to usage on the plateform after 2015. The current usage metrics is available 48-96 hours after online publication and is updated daily on week days.
Initial download of the metrics may take a while.