Fig. 8
Download original image
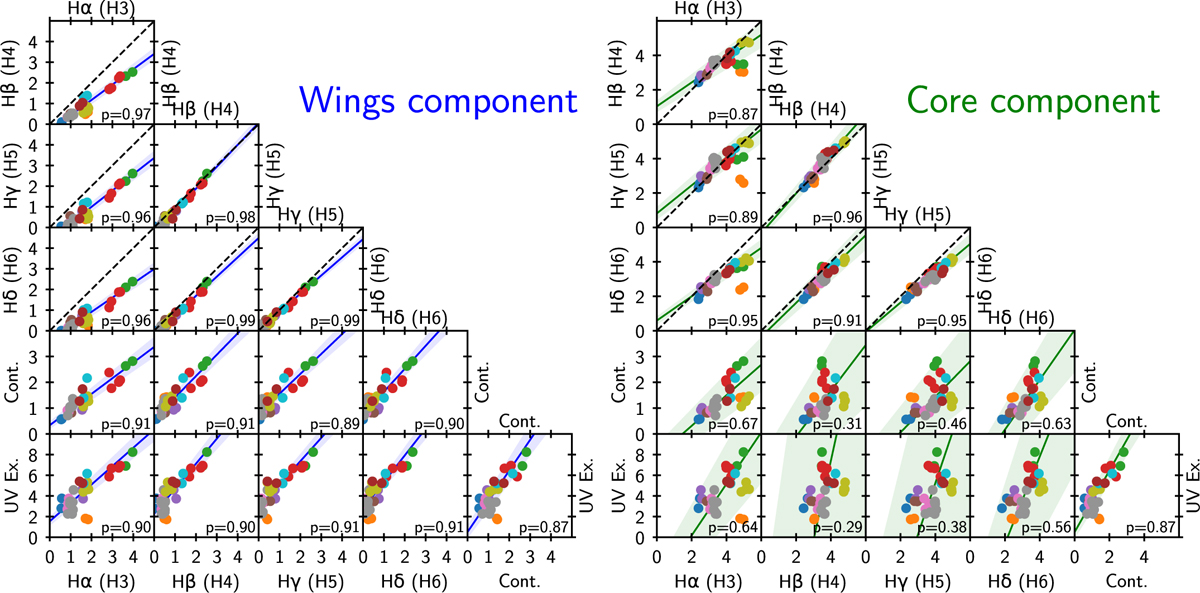
Correlations between the wing and core components over multiple lines (Hα to Hδ), the mean continuum level (cont) around Hα (in 10−17 erg/s/cm2/Å), and the mean level of the UV excess (in 10−17 erg/s/cm2/Å). The Pearson correlation coefficient is given as text in each panel. The dashed black line is the y=x line. The blue and green lines and shaded regions are the best affine fit. The color coding of the data points is the same as in Fig. 4. The x and y units are normalized scaling factors of each component. The epoch on October 13, 2022, (orange) was excluded from the analysis because it is so far off the correlation in the core Hα component. The wing and core components are strongly correlated. However, only the wing components have a strong correlation with the UV excess, which could be due to accretion. The wing component and the UV excess are both strongly correlated with the continuum level around Hα, which suggests that the apparent continuum is veiled by the extension of the apparent continuum.
Current usage metrics show cumulative count of Article Views (full-text article views including HTML views, PDF and ePub downloads, according to the available data) and Abstracts Views on Vision4Press platform.
Data correspond to usage on the plateform after 2015. The current usage metrics is available 48-96 hours after online publication and is updated daily on week days.
Initial download of the metrics may take a while.