Fig. 9
Download original image
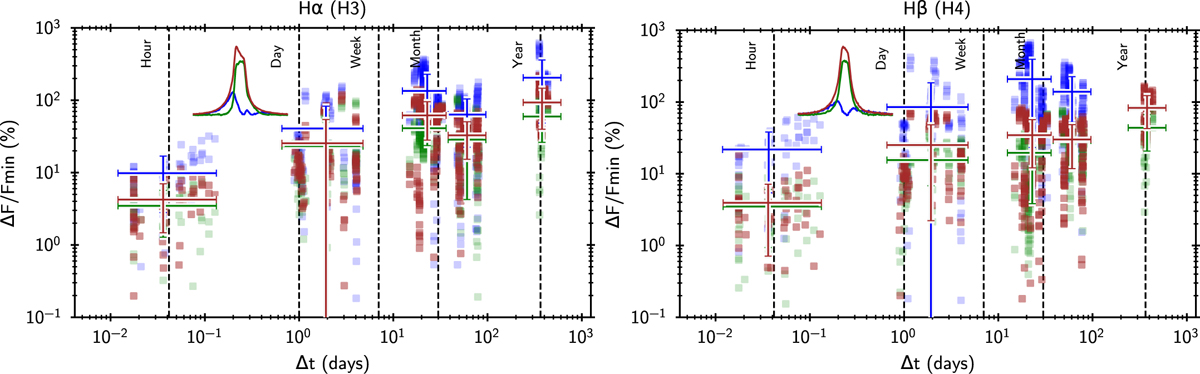
Variability diagrams of Hα (left) and Hβ (right) relative flux for all pairs, as a function of the timescale, following the same method as Demars et al. (2023). We show the variability amplitude of the wing (blue) and core (green) components and of the total profile (dark red). The error bars represent the spread of the variability within a given timescale bin, weighted by the significance of the measurement: the σ-distance between the two lines corresponding to the measurement. Higher order lines have variability diagrams similar to that of Hβ, with slightly increased variability amplitude at hours timescales (see Fig. 10). The full-line variability amplitude is driven by that of the core component, because it contains most of the line flux, whereas the wing component is quite faint in comparison.
Current usage metrics show cumulative count of Article Views (full-text article views including HTML views, PDF and ePub downloads, according to the available data) and Abstracts Views on Vision4Press platform.
Data correspond to usage on the plateform after 2015. The current usage metrics is available 48-96 hours after online publication and is updated daily on week days.
Initial download of the metrics may take a while.