Fig. 6.
Download original image
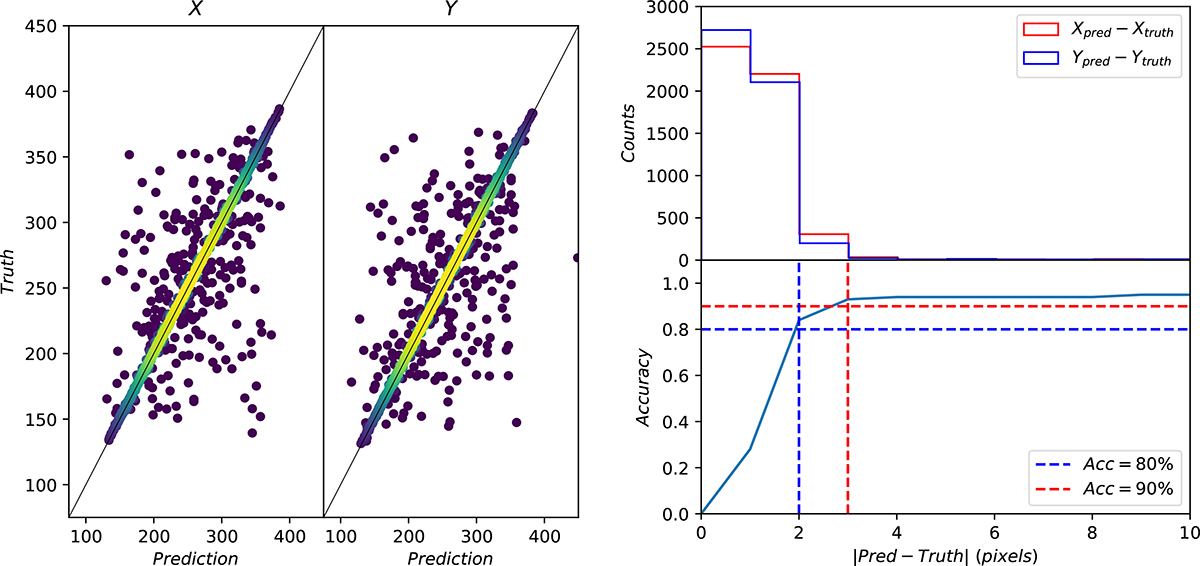
Accuracy of the convolutional ResNet autoencoder described in Sect. 4.2. Left: (x, y) predicted coordinates of the BCGs as a function of their true (x, y) coordinates as given in the cosmoDC2 simulation. The figure shown here is obtained for the BCGs in the evaluation sample. The colour bar represents the number density of points, with yellow representing higher density. Right: Histogram of the difference between the predicted and true (x, y) coordinates of the BCGs in the evaluation sample as detected by the ResNet autoencoder (top). The red and blue histograms represent the x and y coordinates respectively. Accuracy of the ResNet autoencoder depending on the defined resolution considered for a well-detected BCG (bottom). The blue and red lines correspond to an accuracy of 80% and 90%, respectively.
Current usage metrics show cumulative count of Article Views (full-text article views including HTML views, PDF and ePub downloads, according to the available data) and Abstracts Views on Vision4Press platform.
Data correspond to usage on the plateform after 2015. The current usage metrics is available 48-96 hours after online publication and is updated daily on week days.
Initial download of the metrics may take a while.