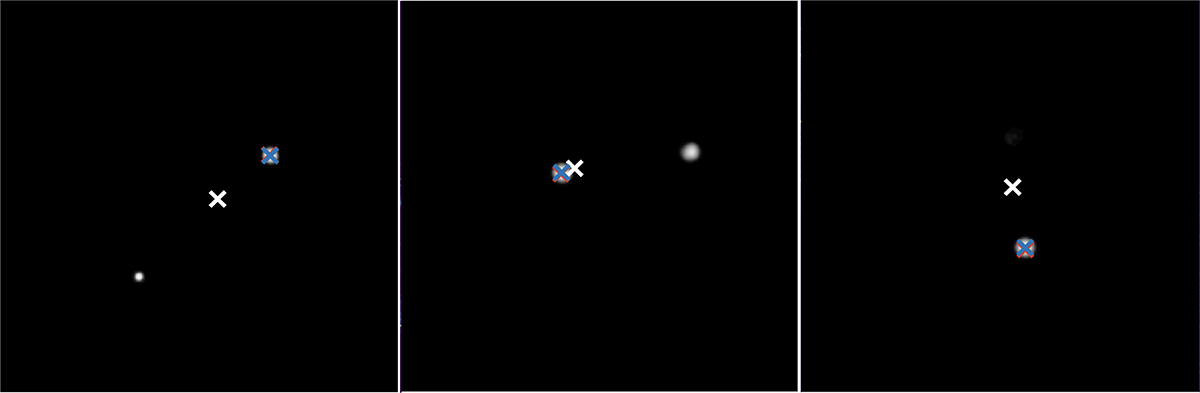
Fig. 7.
Download original image
Example of the same three clusters as shown in Fig. 5. The probability maps were obtained using the ResNet autoencoder described in Sect. 4.2. The blue cross correspond to the position of the detected BCG, associated with the pixel with the highest probability. For comparison are also overlaid the red and white crosses in Fig. 5 corresponding to the position of the predicted BCG by the convolutional ResNet described in Sect. 4.1 and the true BCG respectively.
Current usage metrics show cumulative count of Article Views (full-text article views including HTML views, PDF and ePub downloads, according to the available data) and Abstracts Views on Vision4Press platform.
Data correspond to usage on the plateform after 2015. The current usage metrics is available 48-96 hours after online publication and is updated daily on week days.
Initial download of the metrics may take a while.