Open Access
Fig. 8.
Download original image
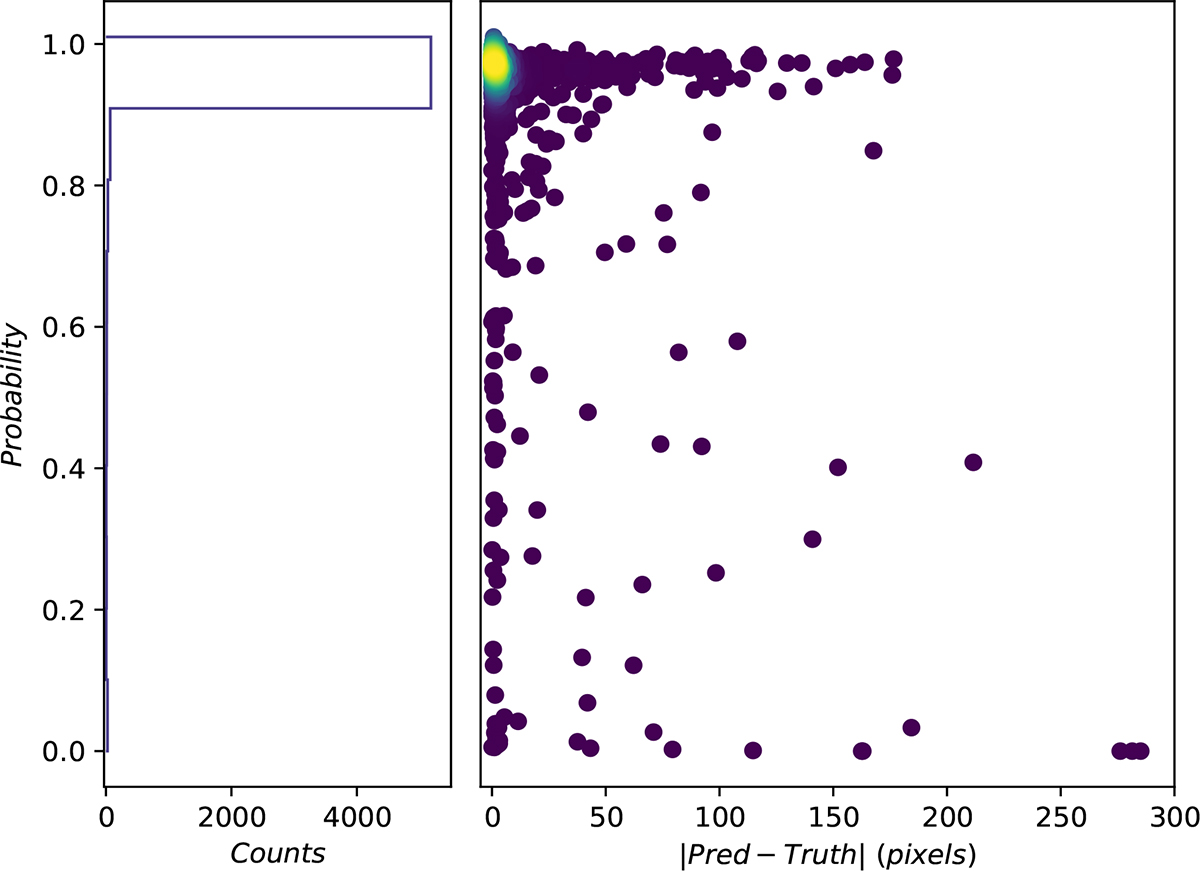
Left: Histogram of the BCG probabilities for the detected BCGs in the evaluation sample. Right: Detection probabilities of the detected BCGs as a function of the offset between the predicted and true coordinates of the BCG. The colour bar represents the number density of points, with yellow representing higher density.
Current usage metrics show cumulative count of Article Views (full-text article views including HTML views, PDF and ePub downloads, according to the available data) and Abstracts Views on Vision4Press platform.
Data correspond to usage on the plateform after 2015. The current usage metrics is available 48-96 hours after online publication and is updated daily on week days.
Initial download of the metrics may take a while.