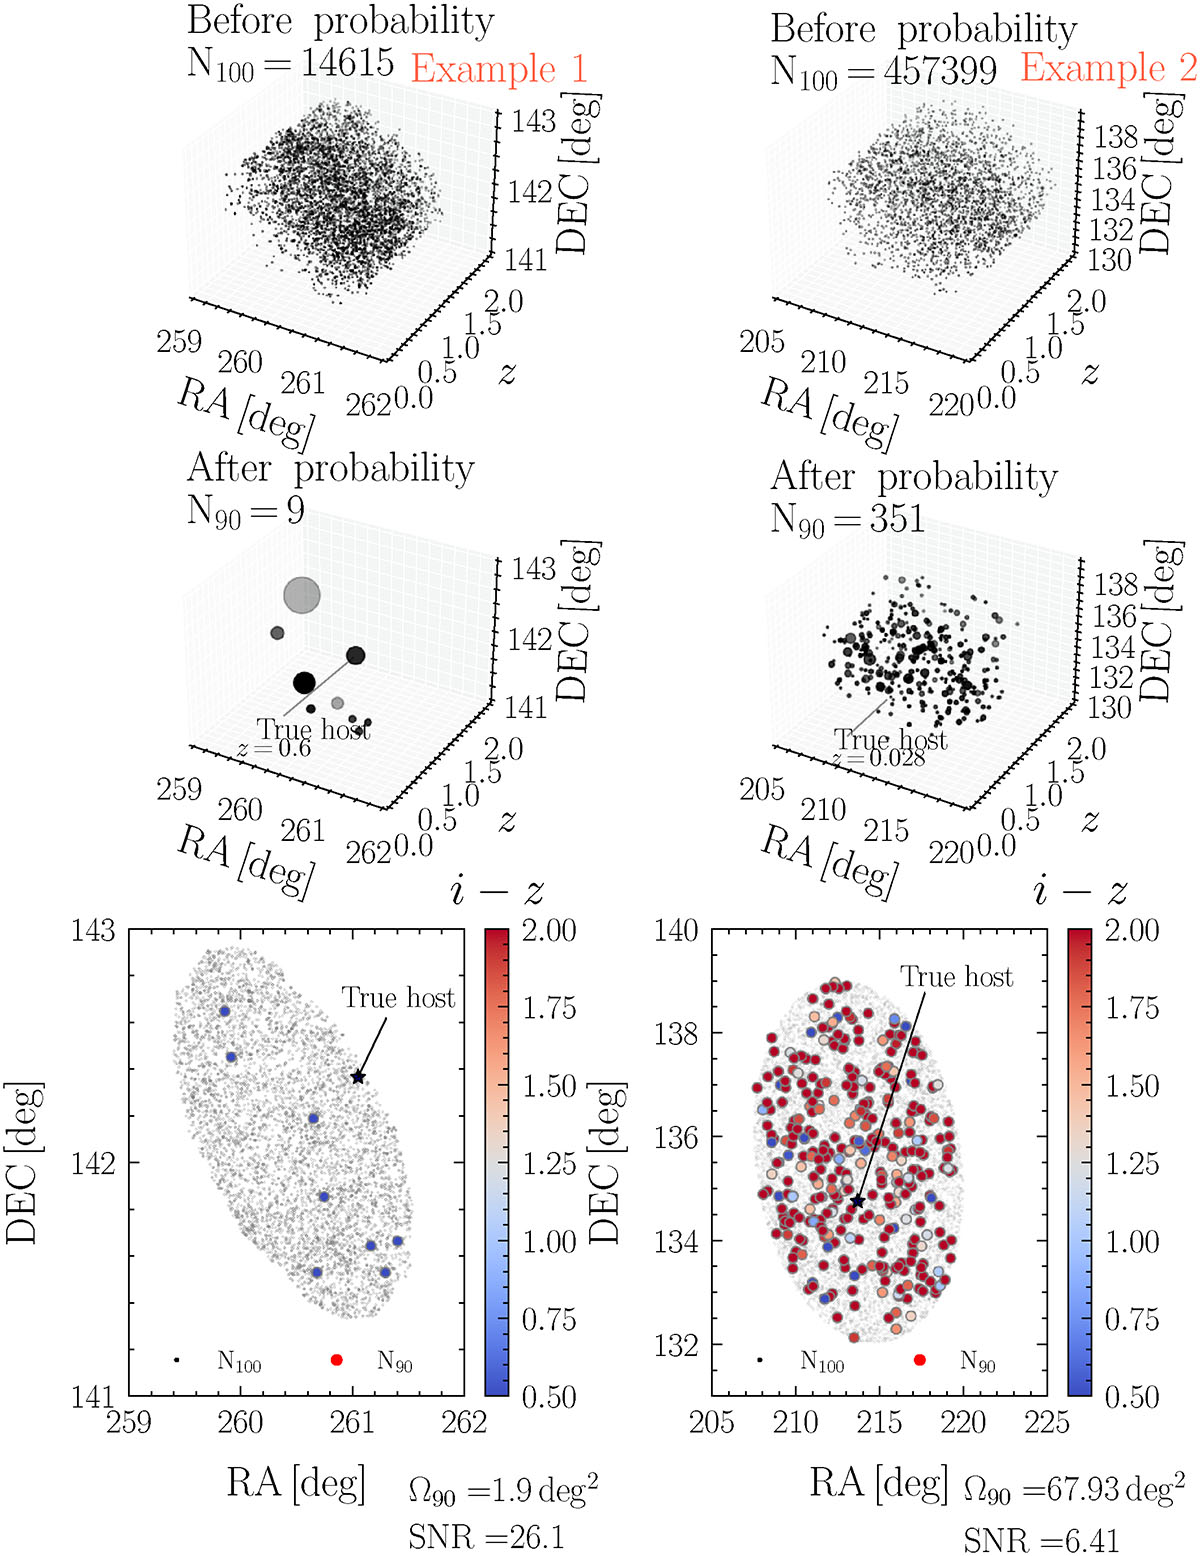
Fig. 10.
Download original image
Distribution in the (RA, Dec, z) space of the galaxies with M∗ > 1010.3 M⊙ and the r-band < 27.5 mag placed within the sky-localization area constrained by SKA PTA. Top panel: Distribution of the galaxies when no probability selection is performed. N100 indicates the total number of these galaxies. Middle panel: Same as top panel but when presenting only the galaxies that contribute to the 90% probability of being the true host (see Section 5). The size of the circle is proportional to the probability. Lower panel: Right ascension and declination plane. The gray (colored) points correspond to all the galaxies in the N100 (N90) sample. The color encodes the photometric color i − z.
Current usage metrics show cumulative count of Article Views (full-text article views including HTML views, PDF and ePub downloads, according to the available data) and Abstracts Views on Vision4Press platform.
Data correspond to usage on the plateform after 2015. The current usage metrics is available 48-96 hours after online publication and is updated daily on week days.
Initial download of the metrics may take a while.