Fig. 11.
Download original image
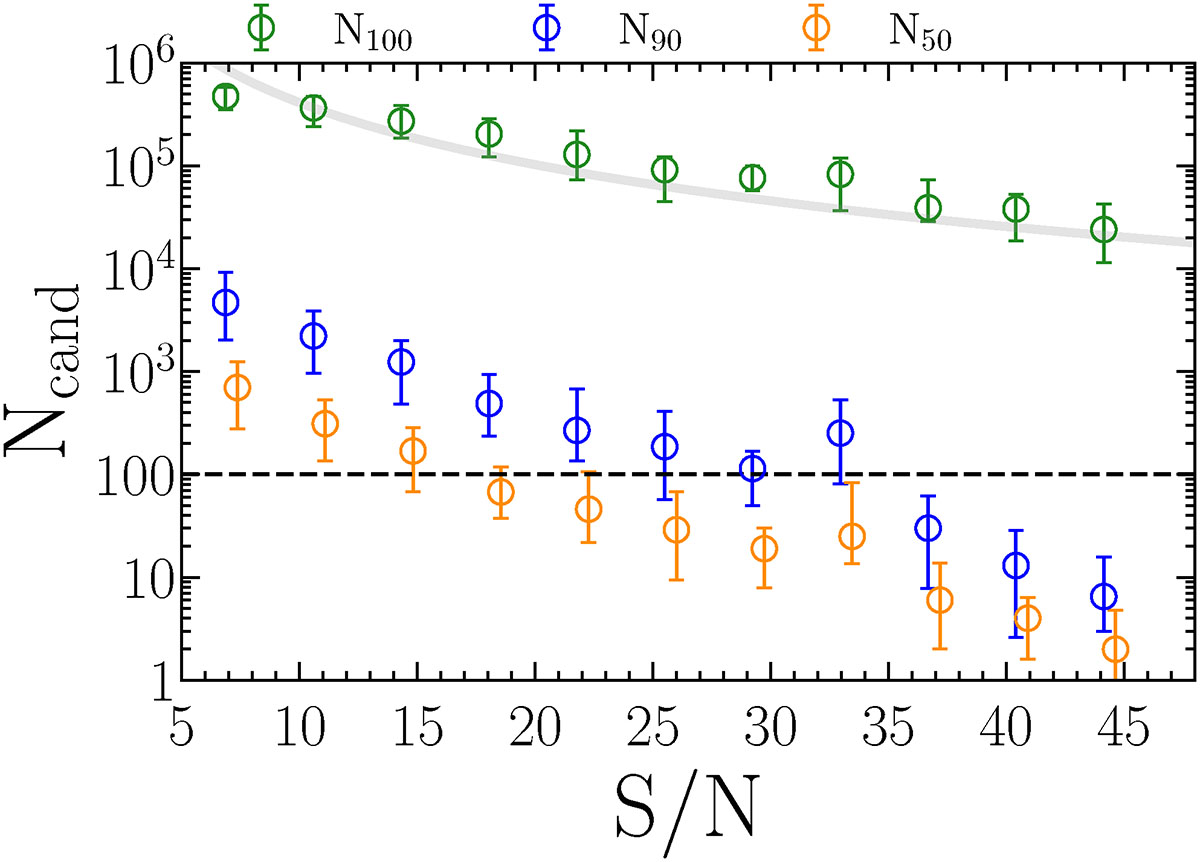
Number of candidates (Ncand) within the sky-localization area depending on the S/N of the detected CGW source. Green circles correspond to the total number of galaxies with M∗ > 1010.3 M⊙ within the detection area (N100). Blue and orange circles represent the same thing, but only including the galaxies contributing 90% and 50% of the total probability of being the true host. To improve the plot clarity, orange points have been shifted by a factor of 0.5. The gray line corresponds to the expected 1/(S/N)2 relation.
Current usage metrics show cumulative count of Article Views (full-text article views including HTML views, PDF and ePub downloads, according to the available data) and Abstracts Views on Vision4Press platform.
Data correspond to usage on the plateform after 2015. The current usage metrics is available 48-96 hours after online publication and is updated daily on week days.
Initial download of the metrics may take a while.