Fig. 13.
Download original image
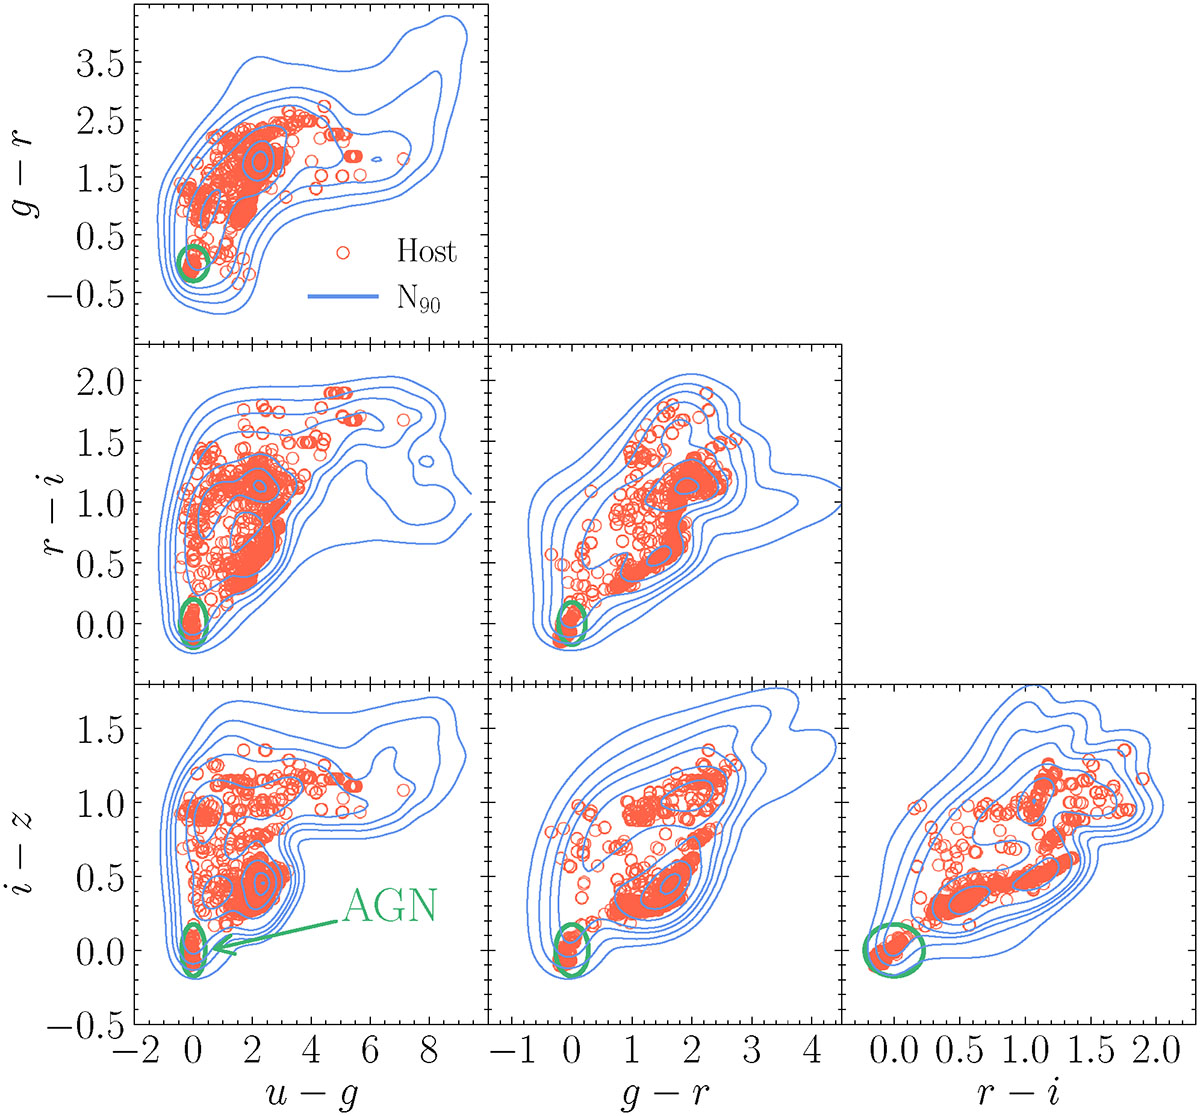
Color-color diagrams for the galaxies hosting the CGW (Hosts, red circles) and the galaxies inside the sky-localization area contributing to 90% probability (N90, blue contours). In all the plots, the distributions correspond to the galaxies associated with CGWs with S/N < 25. Green circles represent the region where AGNs are expected to be placed in the color-color diagram.
Current usage metrics show cumulative count of Article Views (full-text article views including HTML views, PDF and ePub downloads, according to the available data) and Abstracts Views on Vision4Press platform.
Data correspond to usage on the plateform after 2015. The current usage metrics is available 48-96 hours after online publication and is updated daily on week days.
Initial download of the metrics may take a while.