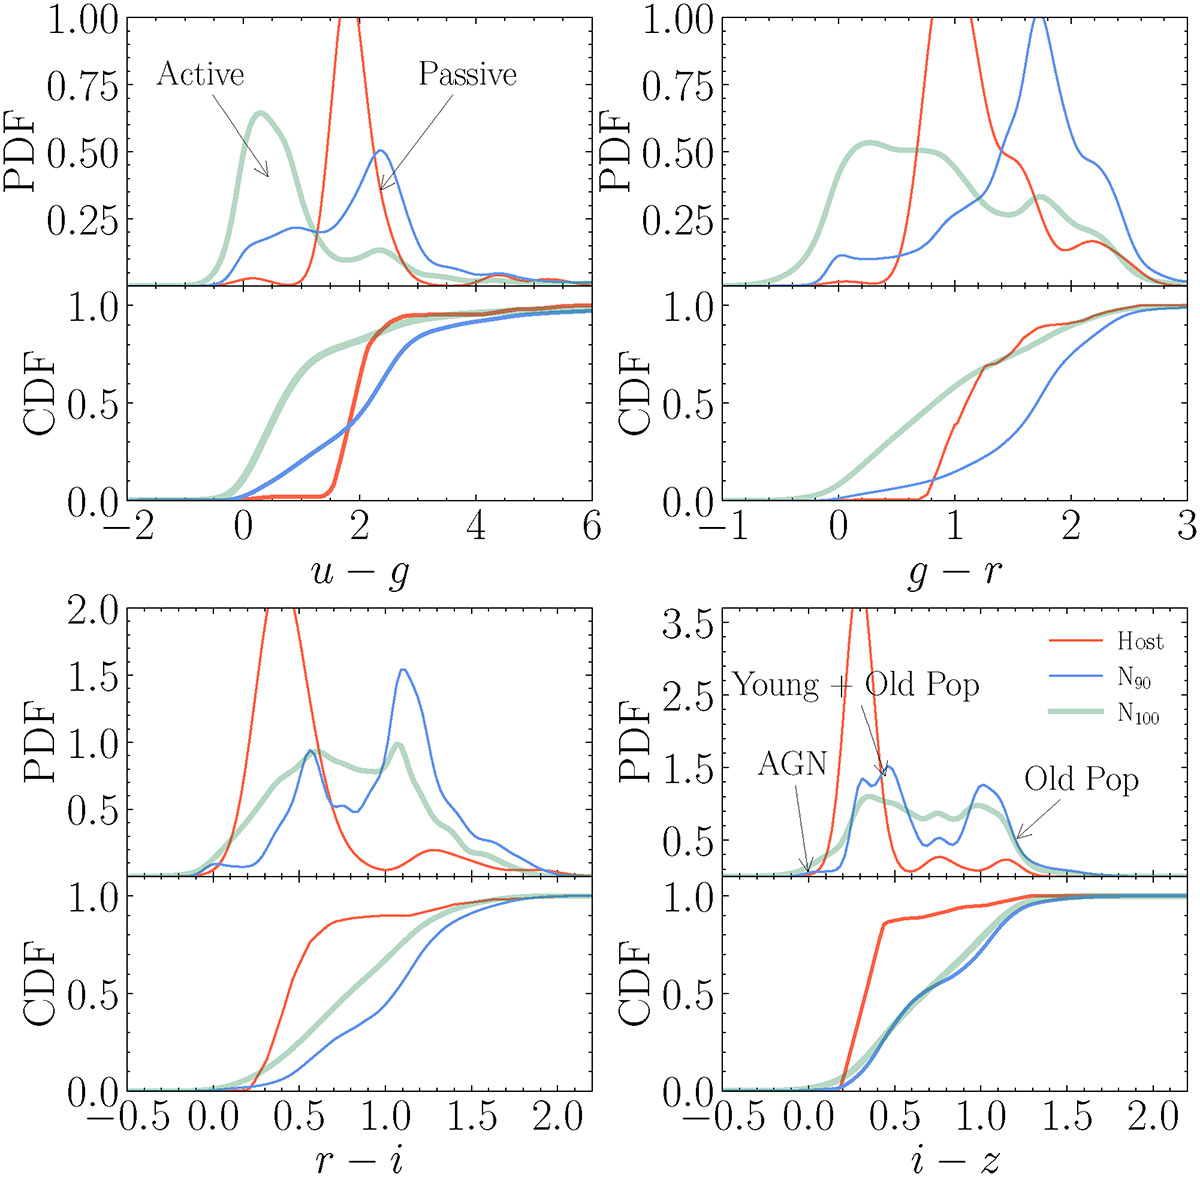
Fig. B.1.
Download original image
Color distribution of the galaxies within the sky-localization area (N100, green), galaxies within the galaxies within the sky-localization area contribution to the 90% probability of being the true host (N90, blue) and the true host (Host, red). Upper panel: Cumulative distribution function (CDF) of the u − g, g − r, r − i and i − z colors for N100, N90 and true host. The horizontal black line corresponds to the value where the CDF of the Host reaches 10%. Lower panels: Probability distribution function (PDF) of the u − g, g − r, r − i and i − z colors for the three samples studied. In all the plots, the distributions correspond to the galaxies associated with CGWs whose S/N > 25.
Current usage metrics show cumulative count of Article Views (full-text article views including HTML views, PDF and ePub downloads, according to the available data) and Abstracts Views on Vision4Press platform.
Data correspond to usage on the plateform after 2015. The current usage metrics is available 48-96 hours after online publication and is updated daily on week days.
Initial download of the metrics may take a while.