Fig. 3.
Download original image
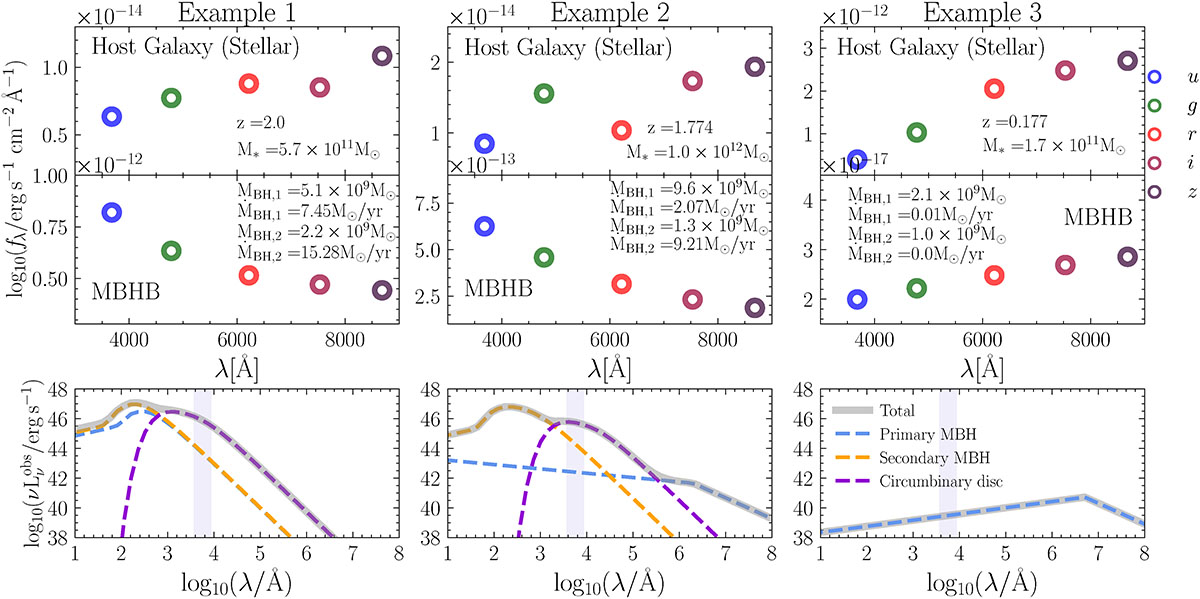
Upper and middle panels: Observed photometry in LSST for three detected MBHBs (upper panels) and the stellar component of their host galaxies (middle panels). Blue, green, red, purple, and brown dots correspond to the flux inside the u, g, r, i, z filters, respectively. The properties of the binary and the host galaxy are indicated in each panel. Lower panels: Observed SED (![]() ) of the MBHB used to compute the photometry (ν and λ are the observed frequency and wavelength, respectively). The blue, orange and purple lines correspond to the emission of the primary MBH, secondary MBH and circumbinary disk, respectively; while the thick gray line is the sum of the three components. The vertical shaded area corresponds to the optical range covered by LSST.
) of the MBHB used to compute the photometry (ν and λ are the observed frequency and wavelength, respectively). The blue, orange and purple lines correspond to the emission of the primary MBH, secondary MBH and circumbinary disk, respectively; while the thick gray line is the sum of the three components. The vertical shaded area corresponds to the optical range covered by LSST.
Current usage metrics show cumulative count of Article Views (full-text article views including HTML views, PDF and ePub downloads, according to the available data) and Abstracts Views on Vision4Press platform.
Data correspond to usage on the plateform after 2015. The current usage metrics is available 48-96 hours after online publication and is updated daily on week days.
Initial download of the metrics may take a while.