Open Access
Fig. 4.
Download original image
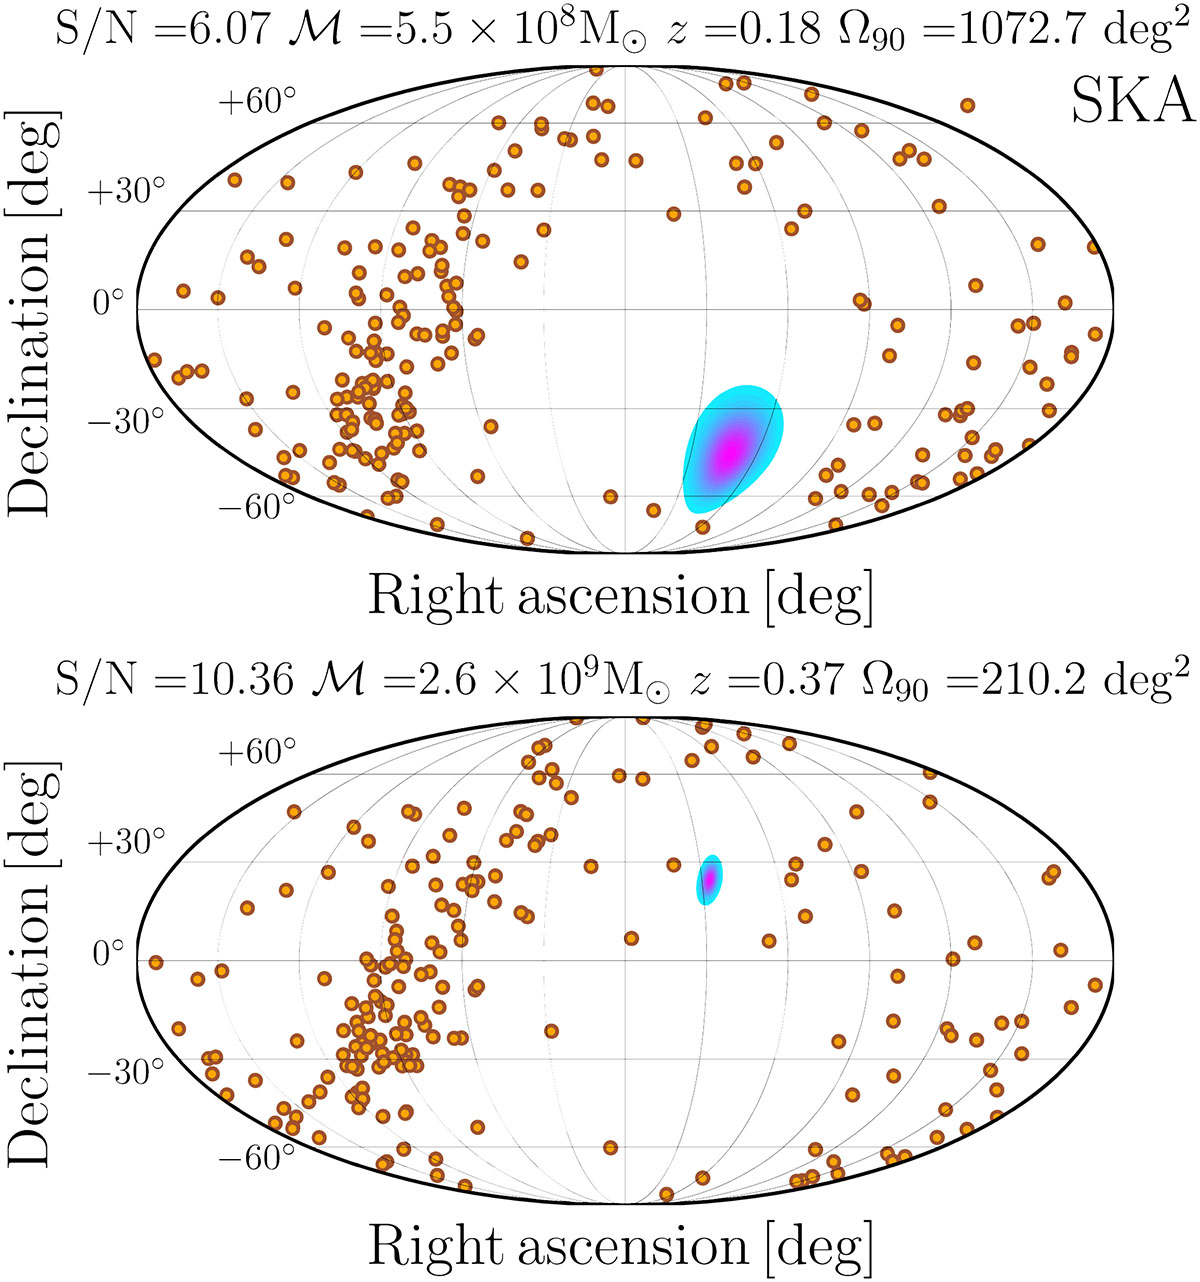
Sky-localization of two different random sources inside our light cones (blue and purple areas). The upper one features a S/N ∼ 6, while the lower one corresponds to S/N ∼ 10. The orange points correspond to the position of the SKA PTA (different from sample to sample as explained in Section 4.2).
Current usage metrics show cumulative count of Article Views (full-text article views including HTML views, PDF and ePub downloads, according to the available data) and Abstracts Views on Vision4Press platform.
Data correspond to usage on the plateform after 2015. The current usage metrics is available 48-96 hours after online publication and is updated daily on week days.
Initial download of the metrics may take a while.