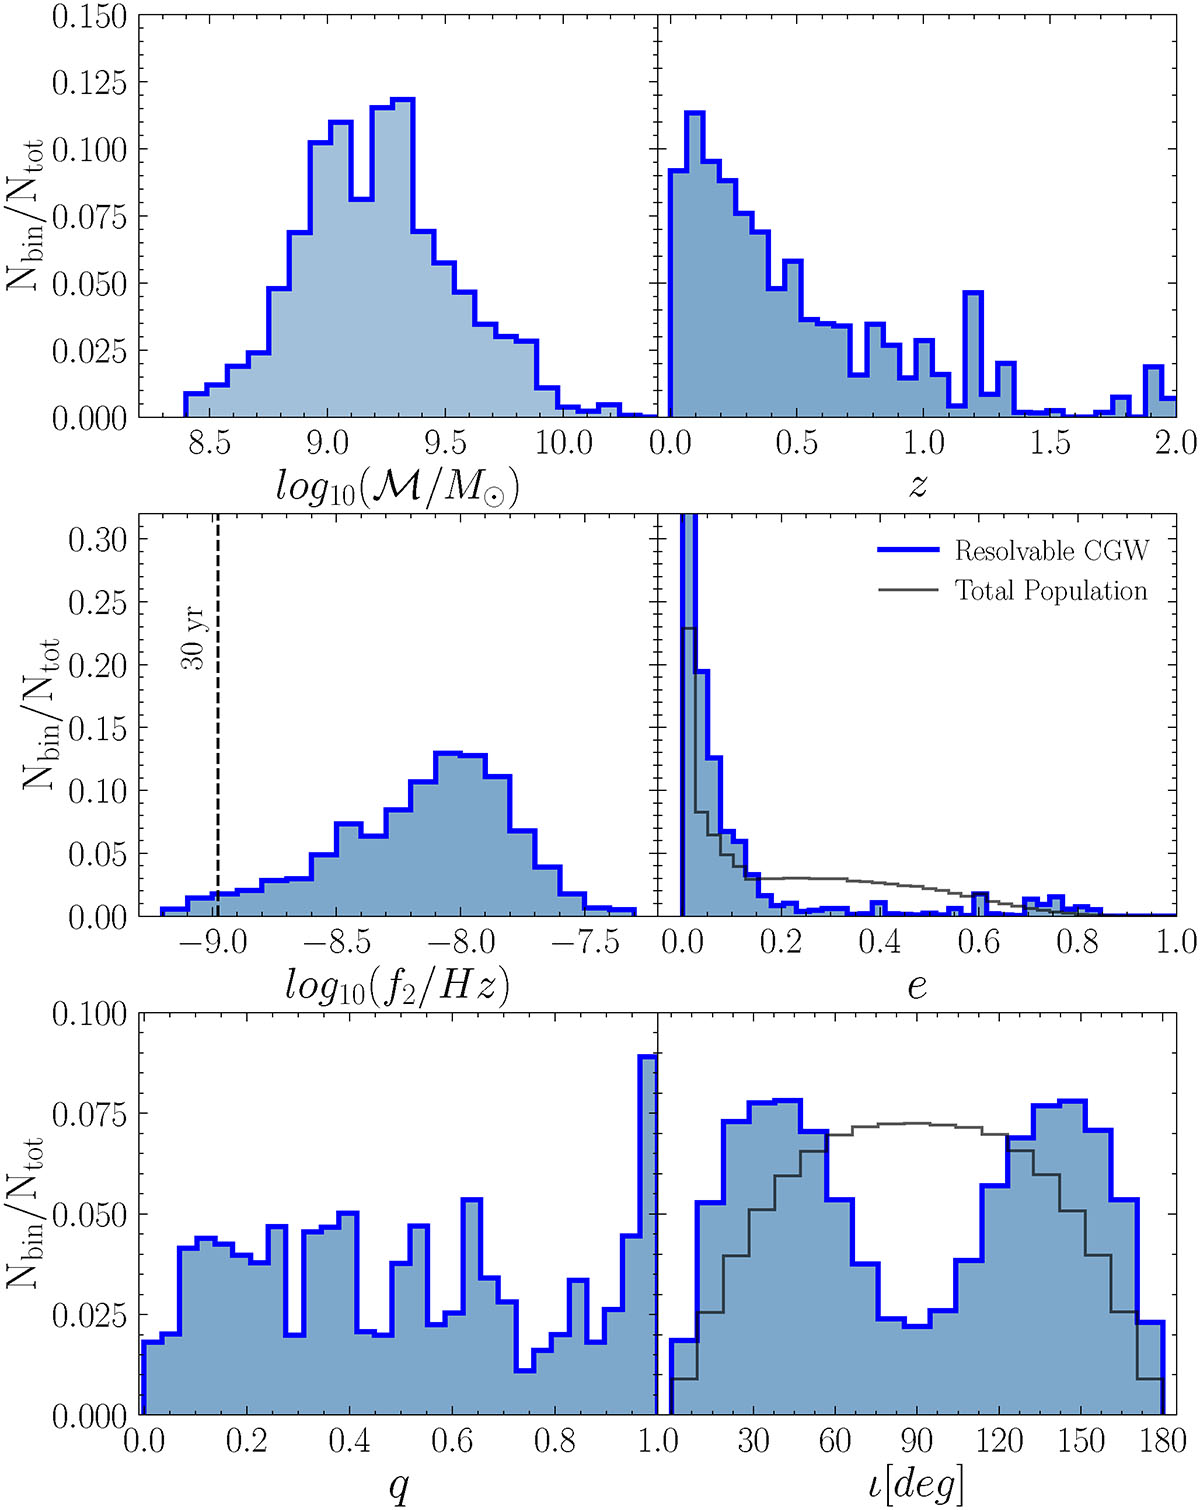
Fig. 6.
Download original image
Properties of the detectable sources by 30 year SKA: Chirp mass distribution (ℳ, upper left panel), redshift (z, upper right panel), twice the observed Keplerian frequency (f2, center left panel), eccentricity (e, center right panel), mass ration (q, lower left panel), and inclination angle (i, lower right panel) of the detected MBHBs. The term NBin represents the number of objects in a given bin of the histogram, while Ntot is the total number of objects analyzed. For reference, we present with black lines the distribution of eccentricity and inclination angle for all the MBHBs presented inside the light cone.
Current usage metrics show cumulative count of Article Views (full-text article views including HTML views, PDF and ePub downloads, according to the available data) and Abstracts Views on Vision4Press platform.
Data correspond to usage on the plateform after 2015. The current usage metrics is available 48-96 hours after online publication and is updated daily on week days.
Initial download of the metrics may take a while.