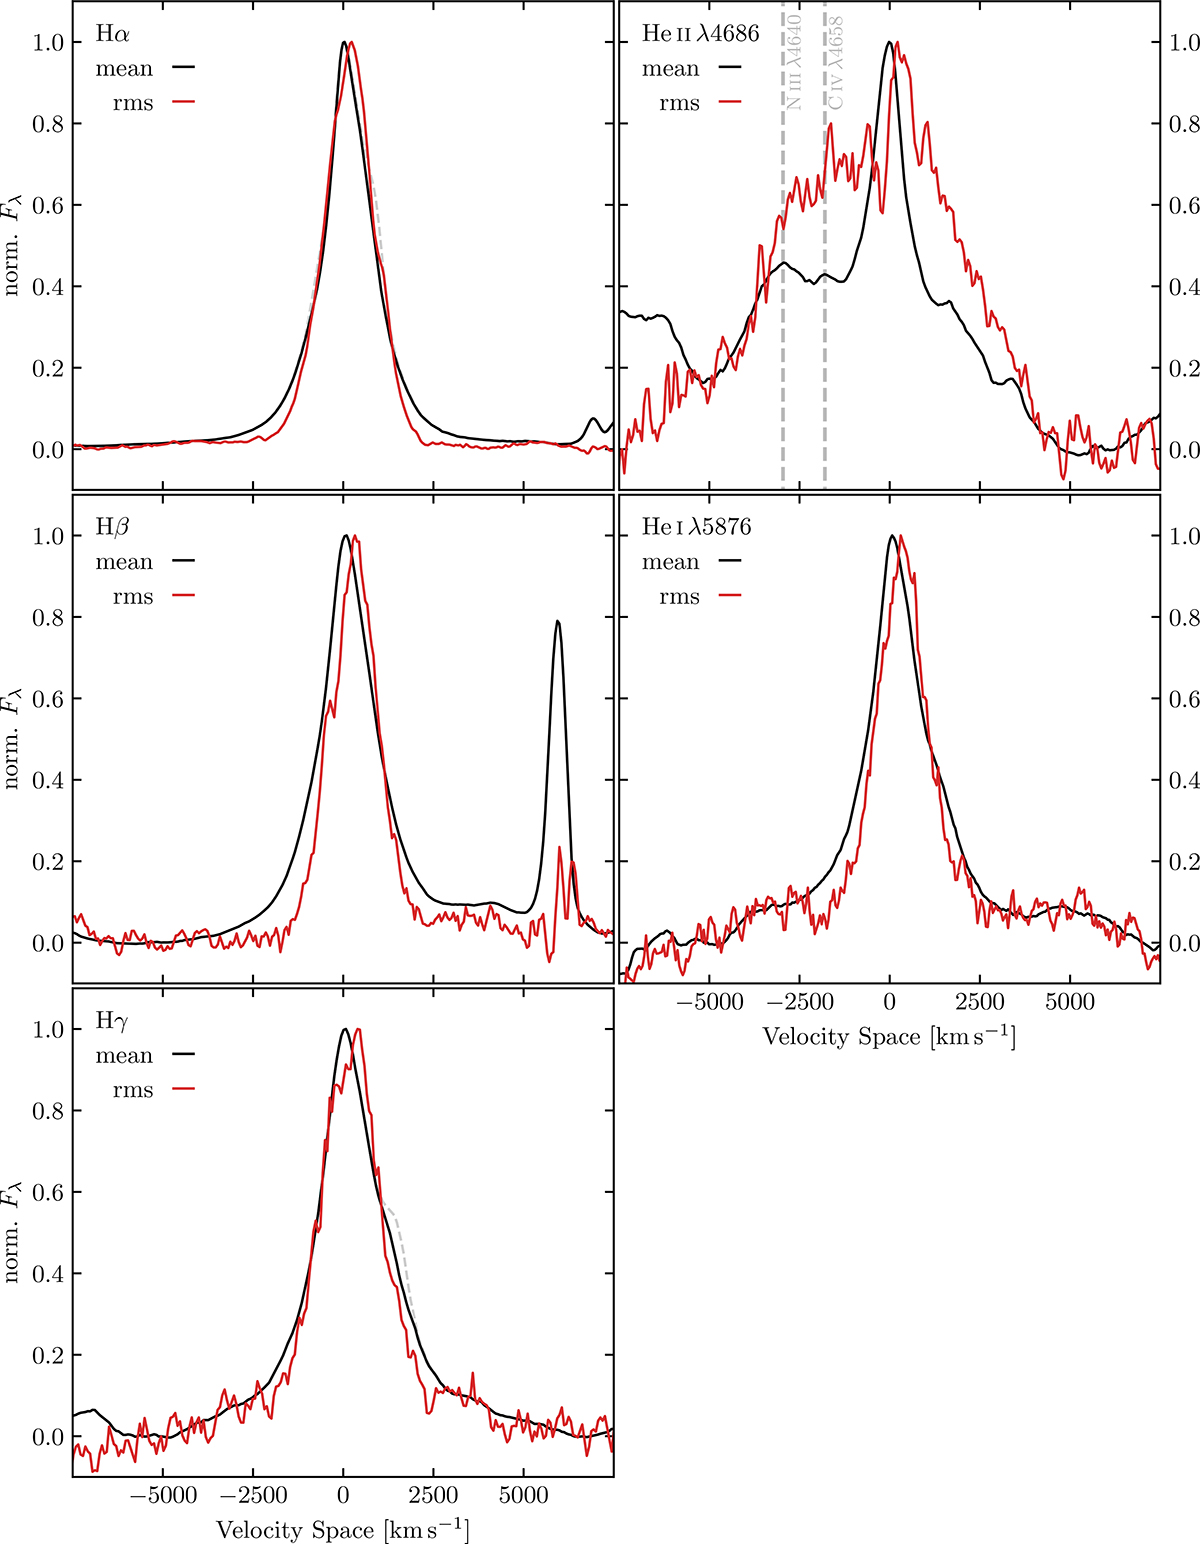
Fig. 10.
Download original image
Normalised mean (black) and rms (red) line profiles of the Balmer and the prominent He Iλ5876 and He IIλ4686 emission lines. While the mean profiles corrected for contributions of narrow forbidden lines are shown in red, the grey dashed line indicates the uncorrected mean profiles of Hα and Hγ. We note that the blue wing of the mean He IIλ4686 profile blends with emission from N IIIλ4640, C IVλ4658, and Fe II (37, 38) multiplets.
Current usage metrics show cumulative count of Article Views (full-text article views including HTML views, PDF and ePub downloads, according to the available data) and Abstracts Views on Vision4Press platform.
Data correspond to usage on the plateform after 2015. The current usage metrics is available 48-96 hours after online publication and is updated daily on week days.
Initial download of the metrics may take a while.