Fig. 11.
Download original image
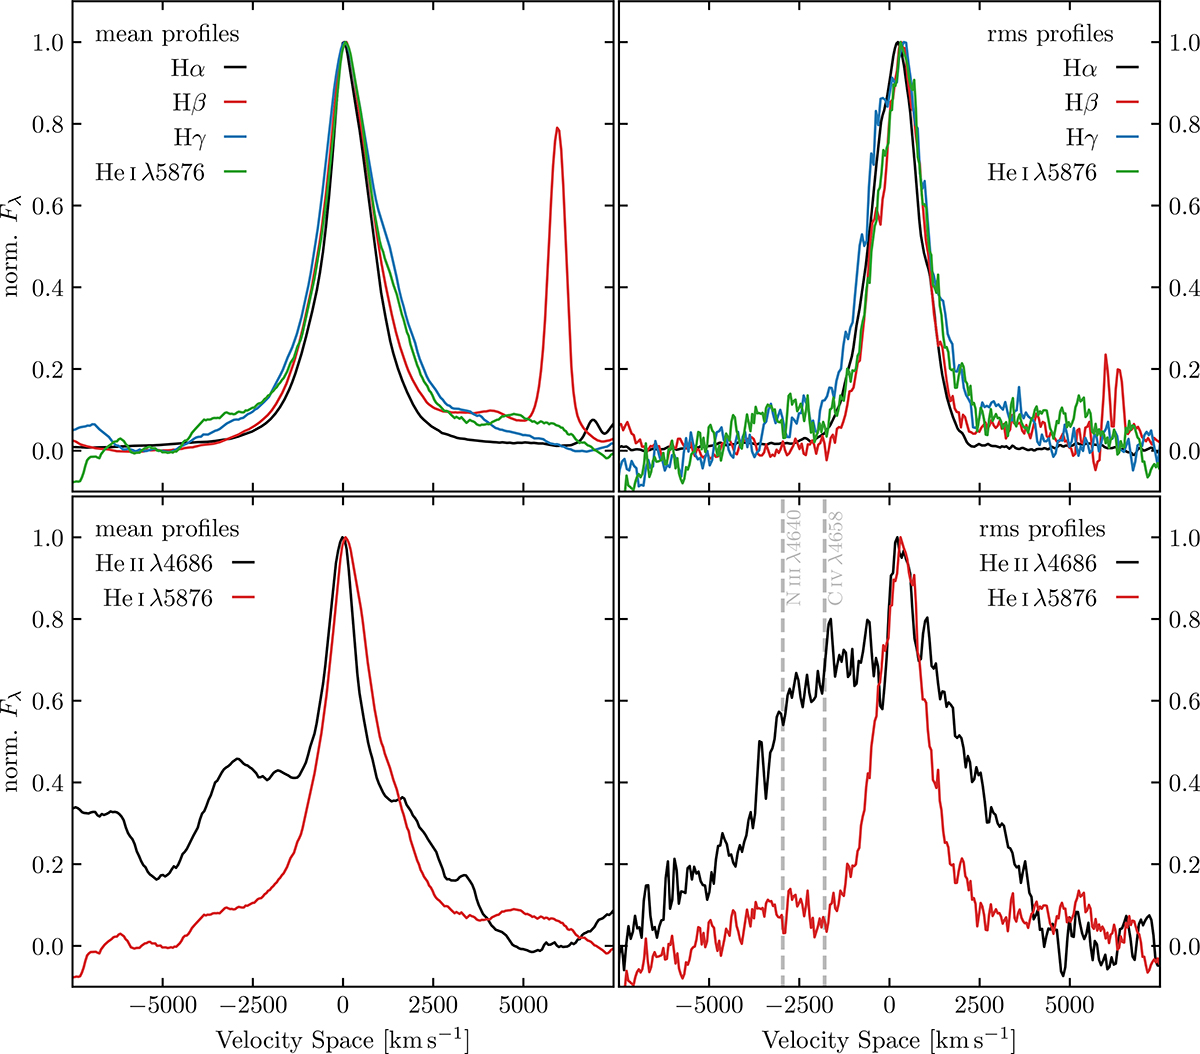
Top panels: Comparison of the normalised mean (left panel) and rms (right panel) line shapes of the Balmer emission lines with the He Iλ5876 emission line. Bottom panels: Comparison of the normalised mean (left panel) and rms (right panel) line shapes of the He Iλ5876 emission line with the He IIλ4686 emission line. We note that the blue wing of the mean He IIλ4686 profile blends with emission from N IIIλ4640, C IVλ4658, and Fe II (37, 38) multiplets.
Current usage metrics show cumulative count of Article Views (full-text article views including HTML views, PDF and ePub downloads, according to the available data) and Abstracts Views on Vision4Press platform.
Data correspond to usage on the plateform after 2015. The current usage metrics is available 48-96 hours after online publication and is updated daily on week days.
Initial download of the metrics may take a while.