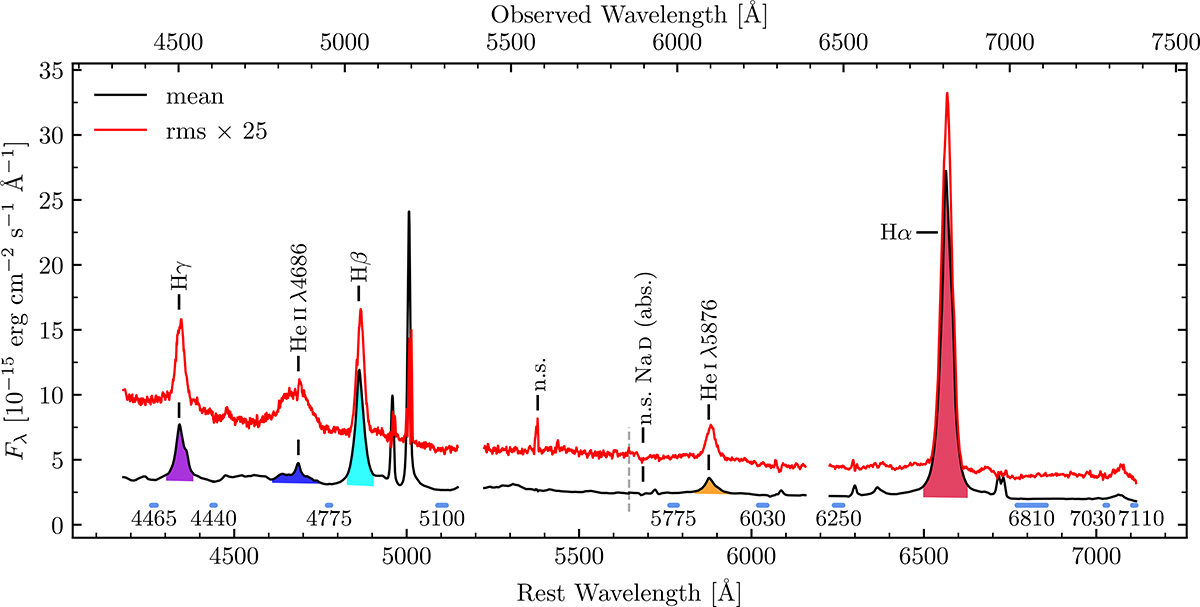
Fig. 2.
Download original image
Combined mean spectrum (black) and rms spectrum (red) of WPVS 48 from our campaign. The partition in the two intercalibrations (see Sect. 2 for details) is shown with a grey dashed line. The rms spectrum was scaled to allow for a direct comparison. The analysed continuum regions and the identical pseudo-continua used for linear continuum subtraction are highlighted with blue bars below the spectra. The line integration limits are marked by the shaded areas. All emission lines of He I are displayed in orange.
Current usage metrics show cumulative count of Article Views (full-text article views including HTML views, PDF and ePub downloads, according to the available data) and Abstracts Views on Vision4Press platform.
Data correspond to usage on the plateform after 2015. The current usage metrics is available 48-96 hours after online publication and is updated daily on week days.
Initial download of the metrics may take a while.