Open Access
Fig. 5.
Download original image
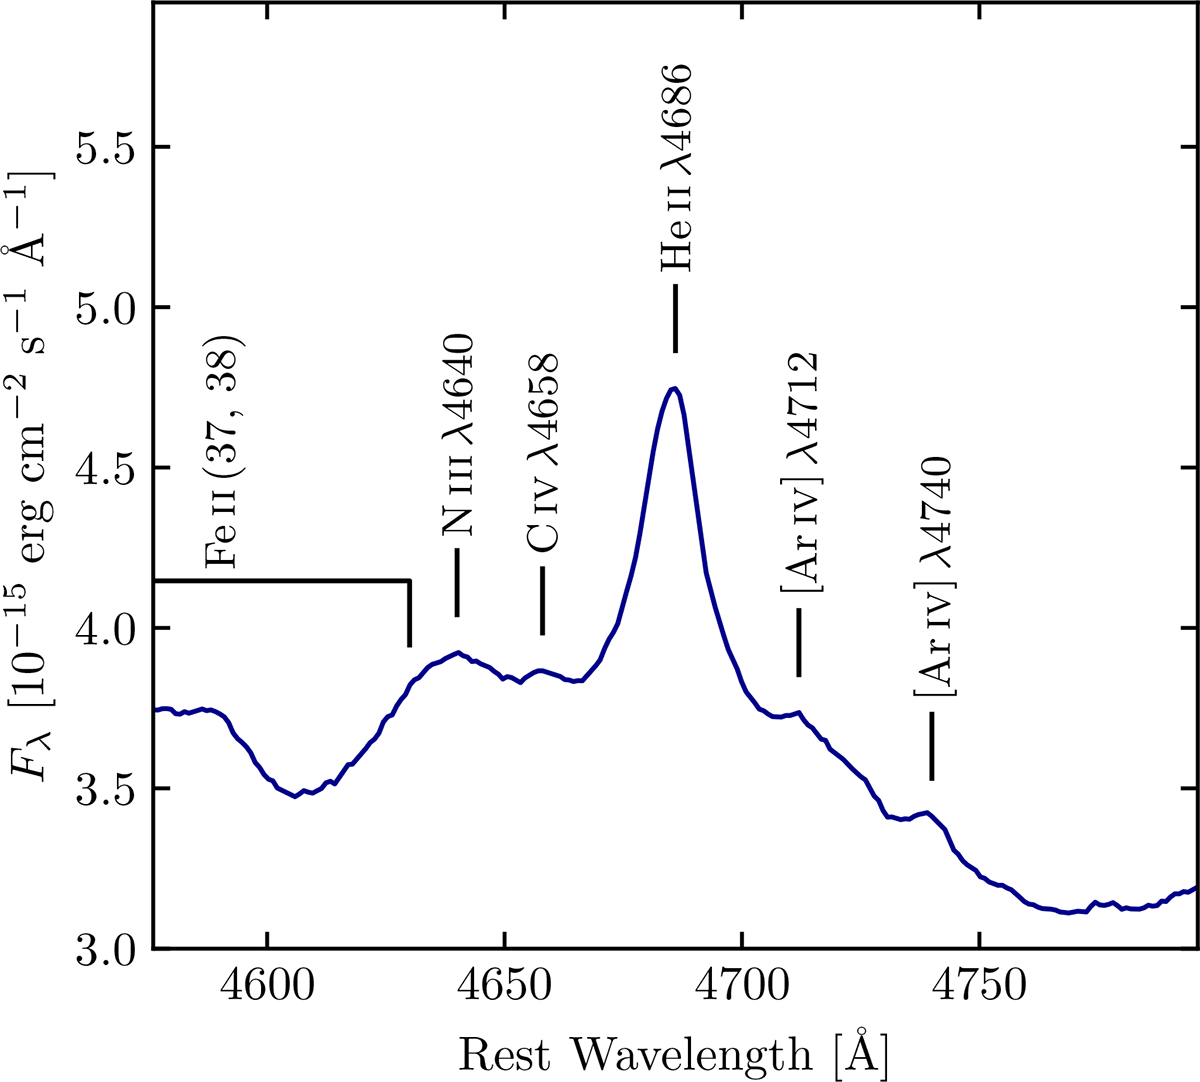
Detailed emission line identification in the mean spectrum close to He IIλ4686. We identify N IIIλ4640 and C IVλ4658 (Osterbrock & Cohen 1982) and further labelled the position of the Fe II (37, 38) emission bands (for a template of Fe II, see Park et al. 2022) as well as [Ar IV] λλ4712, 4740.
Current usage metrics show cumulative count of Article Views (full-text article views including HTML views, PDF and ePub downloads, according to the available data) and Abstracts Views on Vision4Press platform.
Data correspond to usage on the plateform after 2015. The current usage metrics is available 48-96 hours after online publication and is updated daily on week days.
Initial download of the metrics may take a while.