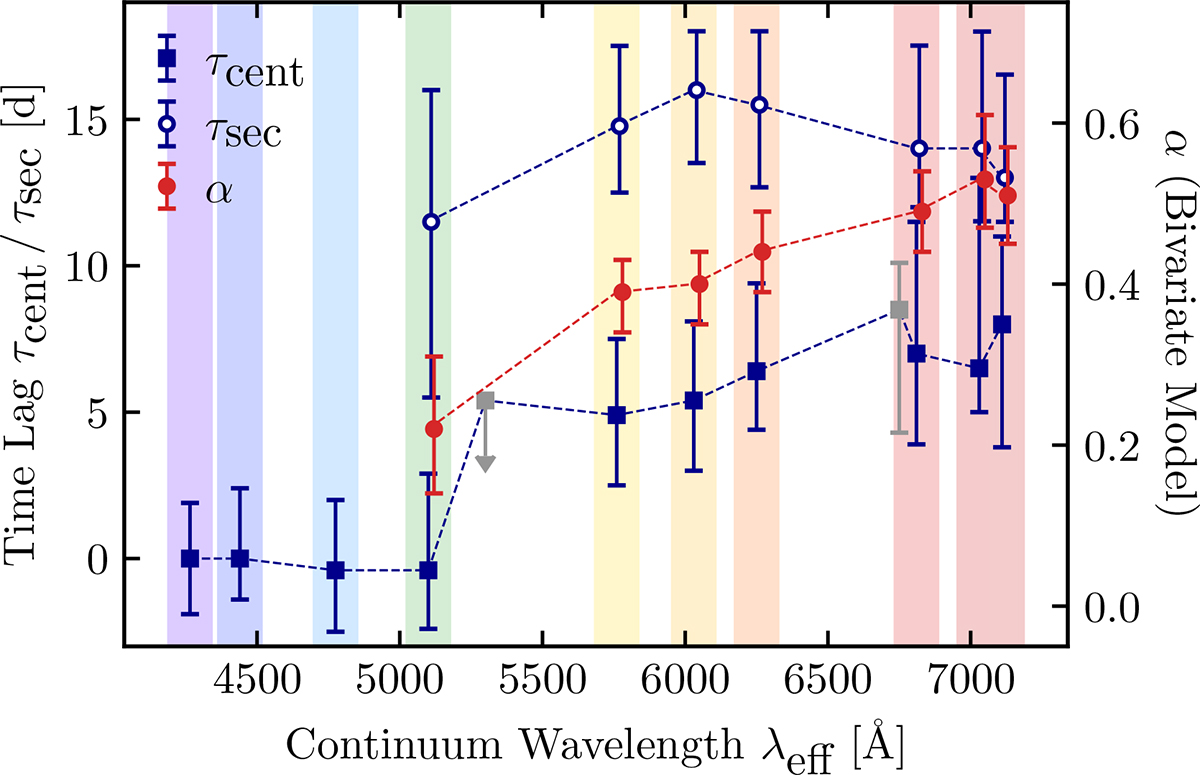
Fig. 7.
Download original image
Mean centroid lags τcent according to the univariate model (blue squares) as well as centroid lags τsec (blue circles) and fractional contribution α (red circles) of the secondary component according to the bivariate model (Chelouche et al. 2019) as a function of the effective wavelength of the continuum. We include the univariate lags of photometric light curves published by Sobrino Figaredo et al. (2018) as grey squares. We note that Hβ contributes to the flux in the V band. The lags and the fractional contribution are measured with respect to the continuum at 4265 Å as a function of the effective wavelength of the continuum. The colouring of the shaded background corresponds to the light curves in Fig. 6. The errors correspond to the 68% (±1σ) confidence level after a Monte-Carlo simulation with 20 000 runs. The data of τsec and α have been slightly shifted in wavelength for better readability.
Current usage metrics show cumulative count of Article Views (full-text article views including HTML views, PDF and ePub downloads, according to the available data) and Abstracts Views on Vision4Press platform.
Data correspond to usage on the plateform after 2015. The current usage metrics is available 48-96 hours after online publication and is updated daily on week days.
Initial download of the metrics may take a while.