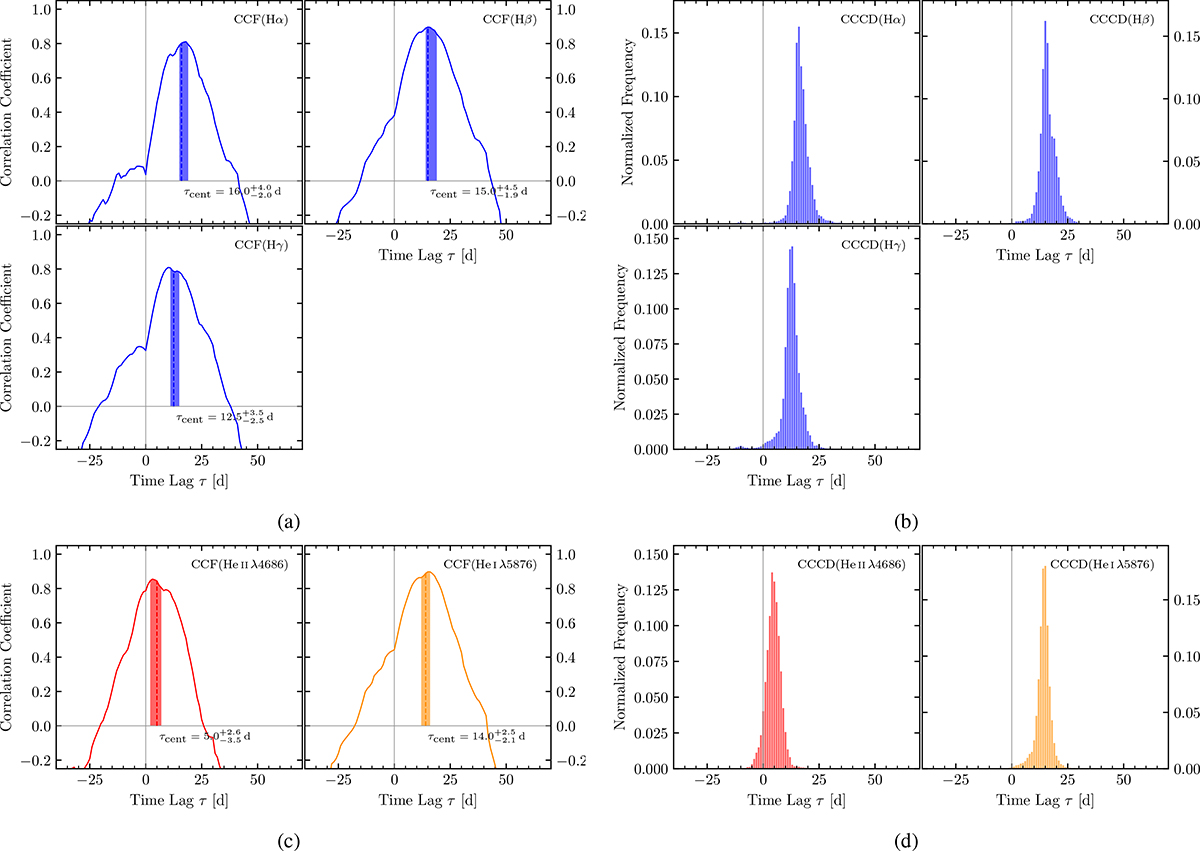
Fig. 9.
Download original image
Left panels: CCFs of the integrated Balmer lines in blue, the integrated He I λ5876 line in orange and the integrated He II λ4686 line in red, with respect to the continuum light curve at 5100 Å. The time lag, τcent, is denoted by a dashed line; the shaded area corresponds to a ±1σ interval from the Monte-Carlo simulations. Right panels: Cross-correlation centroid distributions after 20 000 runs employing FR and RSS of the integrated Balmer lines in blue, the integrated He I λ5876 line in orange and the integrated He II λ4686 line in red, with respect to the continuum at 5100 Å.
Current usage metrics show cumulative count of Article Views (full-text article views including HTML views, PDF and ePub downloads, according to the available data) and Abstracts Views on Vision4Press platform.
Data correspond to usage on the plateform after 2015. The current usage metrics is available 48-96 hours after online publication and is updated daily on week days.
Initial download of the metrics may take a while.