Fig. 1.
Download original image
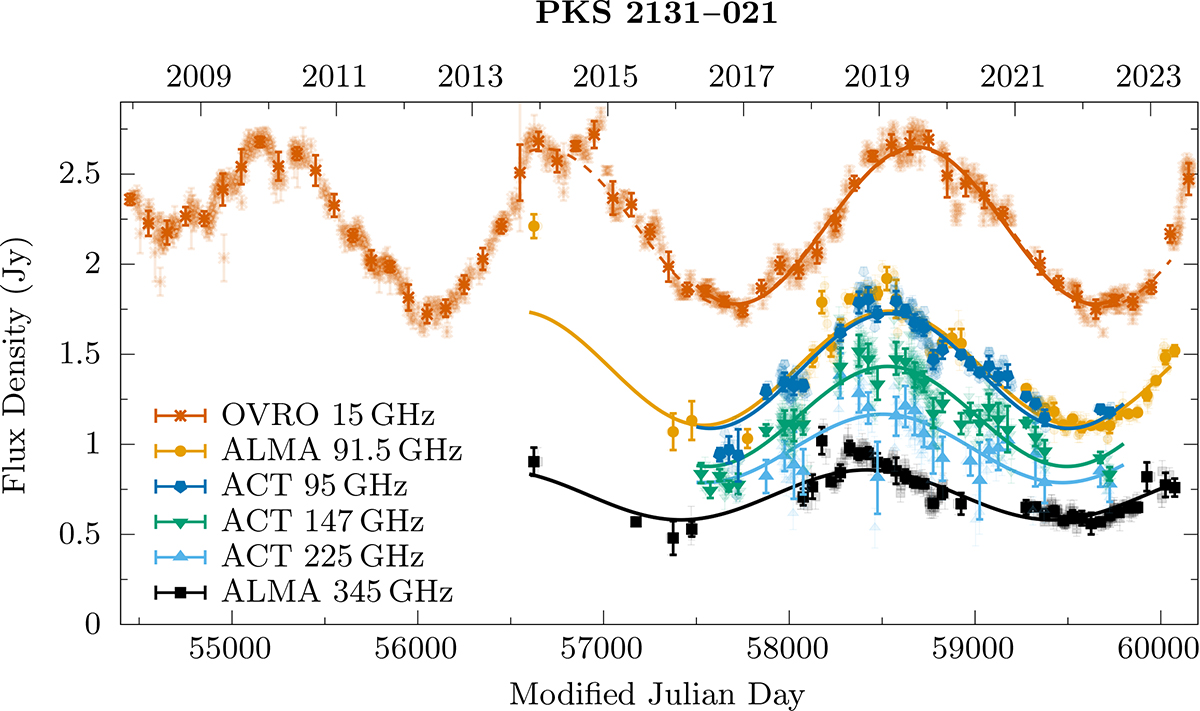
PKS 2131–021 light curves from OVRO, ACT, and ALMA. Heavy points are binned into 50-day intervals (100 for OVRO) to guide the eye, with individual measurements shown as lighter points. Sinusoidal fits, shown with the continuous curves, were done on the unbinned data. The sine fits for ALMA are from K25 and sine fits to ACT were done for this paper (see text). For the OVRO data, the solid curve is the best fit for the ACT time range, while the dashed sine curve corresponds to the ALMA time range. A monotonic phase shift of the sine waves to earlier times with increasing frequency is visible by eye, and is reported relative to the OVRO phase as Δϕ0 in Tables 1 and B.1.
Current usage metrics show cumulative count of Article Views (full-text article views including HTML views, PDF and ePub downloads, according to the available data) and Abstracts Views on Vision4Press platform.
Data correspond to usage on the plateform after 2015. The current usage metrics is available 48-96 hours after online publication and is updated daily on week days.
Initial download of the metrics may take a while.