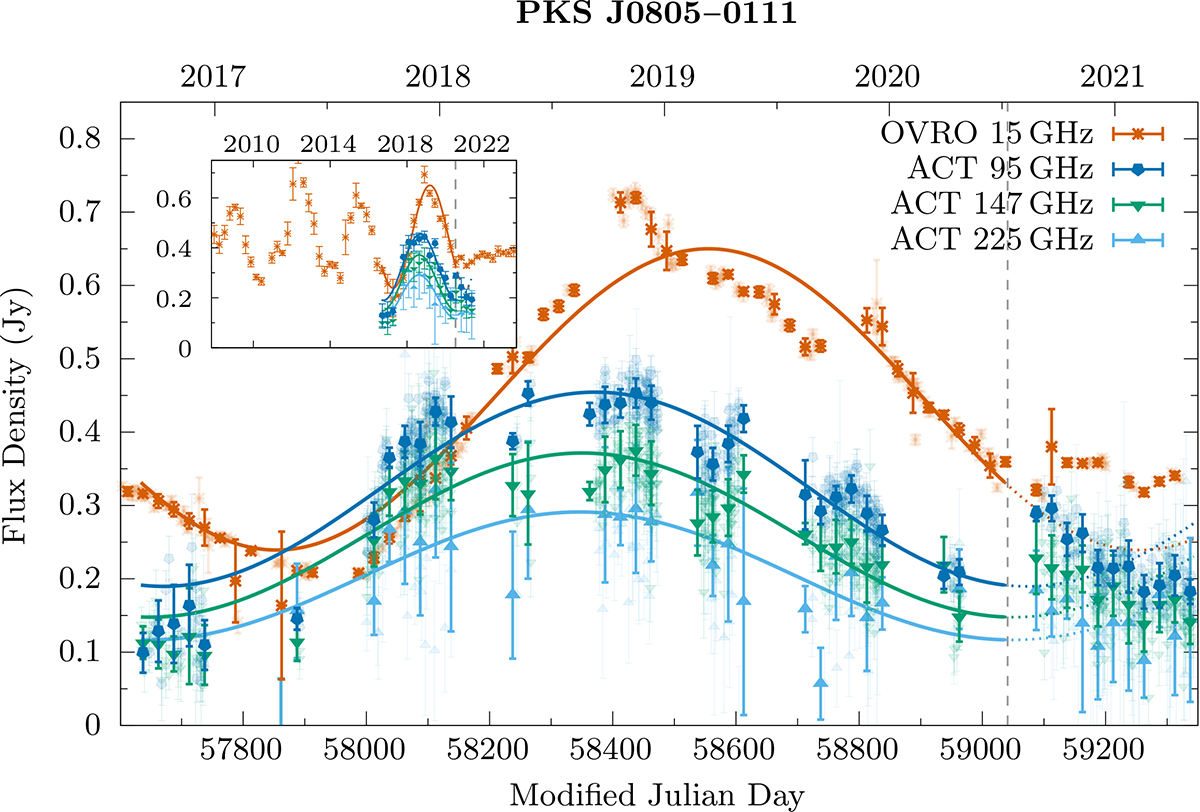
Fig. 3.
Download original image
PKS J0805–0111 light curves at 15 GHz, 95 GHz, 147 GHz, and 225 GHz. The main panel shows the time range covered by the ACT observations, while the inset shows the full range observed by OVRO. Heavy points are binned into 25-day intervals (100 days in the inset) to guide the eye, with individual measurements shown as lighter points; the sinusoidal least-squares fits were done on the unbinned data. A monotonic phase shift of the sine waves to earlier times with increasing frequency is visible by eye, and is reported relative to the OVRO phase as Δϕ0 in Table 2. The dashed vertical line at MJD 59041 (2020 July 11) indicates the approximate date at which D25 found that the sinusoidal variation in the 15 GHz ceases. The ACT mm data also apparently flatten around the same time.
Current usage metrics show cumulative count of Article Views (full-text article views including HTML views, PDF and ePub downloads, according to the available data) and Abstracts Views on Vision4Press platform.
Data correspond to usage on the plateform after 2015. The current usage metrics is available 48-96 hours after online publication and is updated daily on week days.
Initial download of the metrics may take a while.