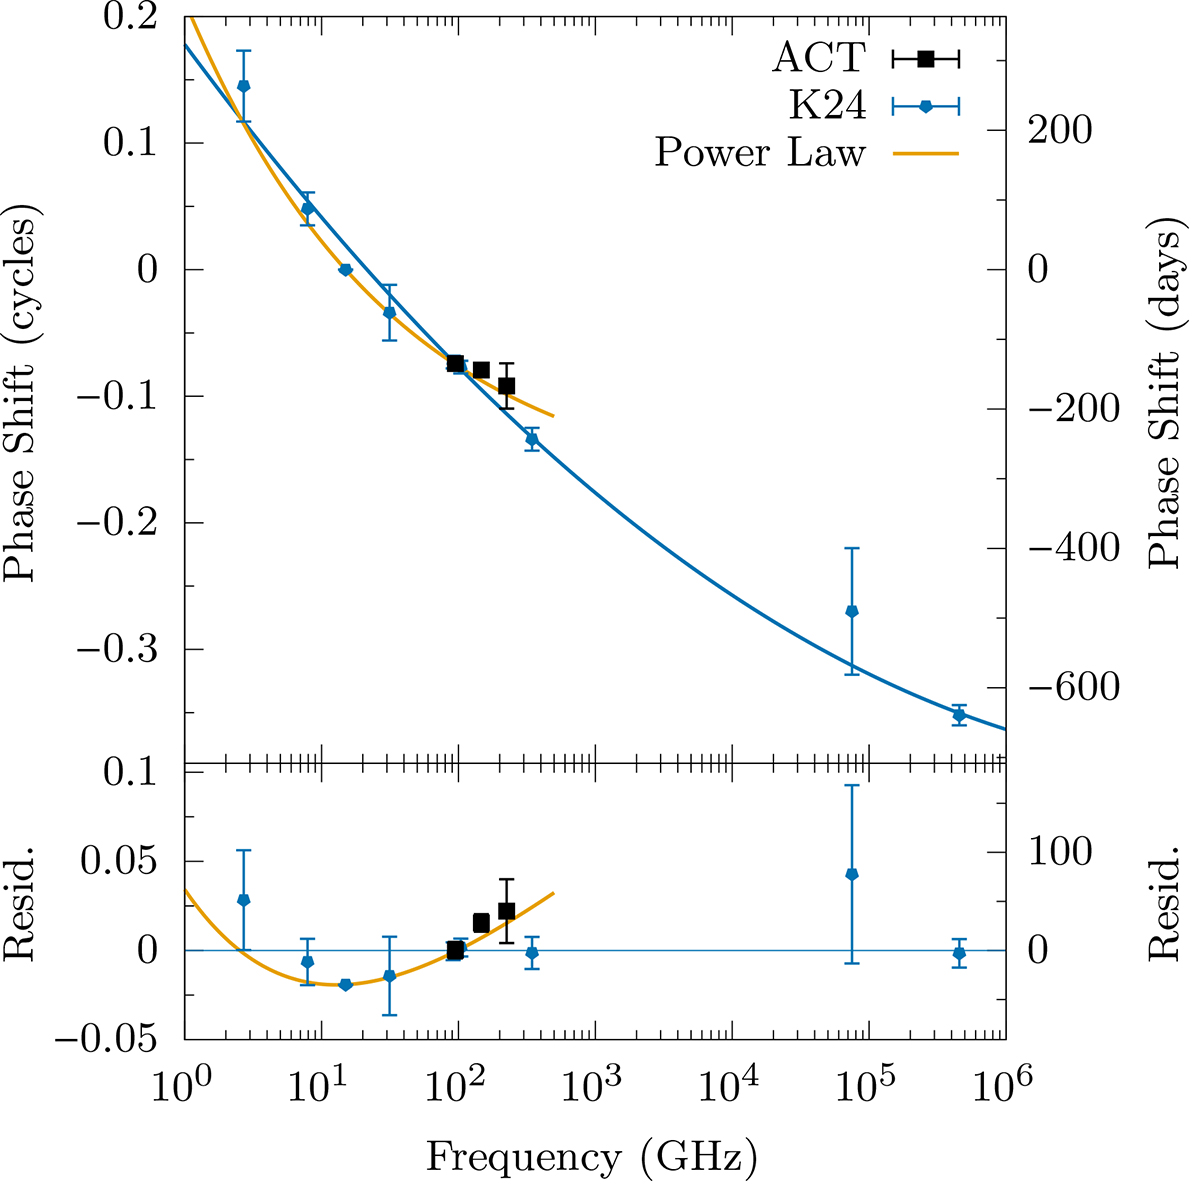
Fig. 4.
Download original image
PKS 2131–021 phase shifts measured by ACT at 95, 147, and 225 GHz (black points), compared to the phase shift results of K25 (blue points); see Table 3. We note that the ACT 95 GHz and ALMA 91.5 GHz points overlap. The Haystack or OVRO 15 GHz light curves provided the phase reference in all cases. Uncertainties were determined by the MCMC sine-wave fits (Eq. (1)). The curved blue line shows the quadratic fit determined by K25 (Eq. (3)). The orange line is the best-fit power law to the Haystack, ALMA, and ACT data (Eq. (4), Table 5).
Current usage metrics show cumulative count of Article Views (full-text article views including HTML views, PDF and ePub downloads, according to the available data) and Abstracts Views on Vision4Press platform.
Data correspond to usage on the plateform after 2015. The current usage metrics is available 48-96 hours after online publication and is updated daily on week days.
Initial download of the metrics may take a while.