Open Access
Fig. 5.
Download original image
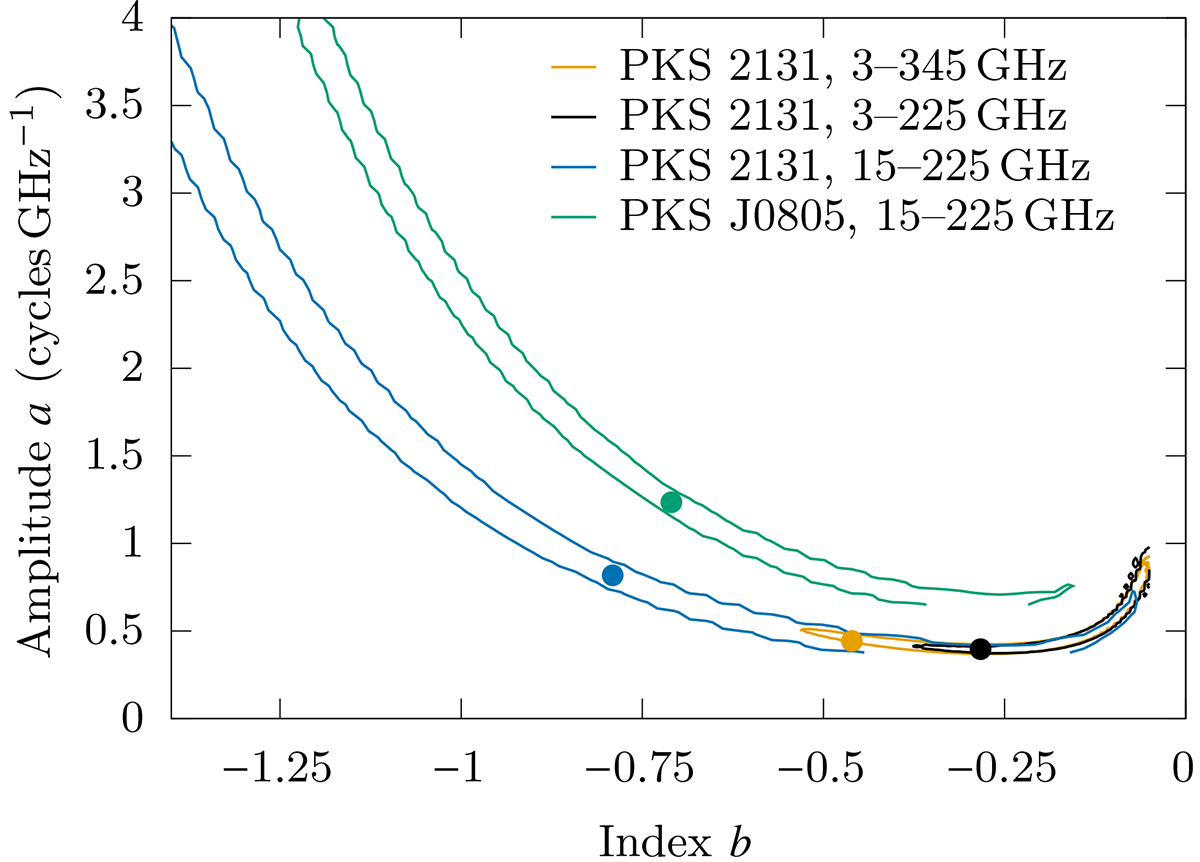
Posterior probabilities of the power-law MC fit to the sinusoid phase shifts (Eq. (4)) for different data combinations. The contours show the 95% credible regions and the dots are the maximum likelihood values (cf. Table 5). Flat priors on a and b in the ranges of (0.05, 4) and (−2, −0.05) were used.
Current usage metrics show cumulative count of Article Views (full-text article views including HTML views, PDF and ePub downloads, according to the available data) and Abstracts Views on Vision4Press platform.
Data correspond to usage on the plateform after 2015. The current usage metrics is available 48-96 hours after online publication and is updated daily on week days.
Initial download of the metrics may take a while.