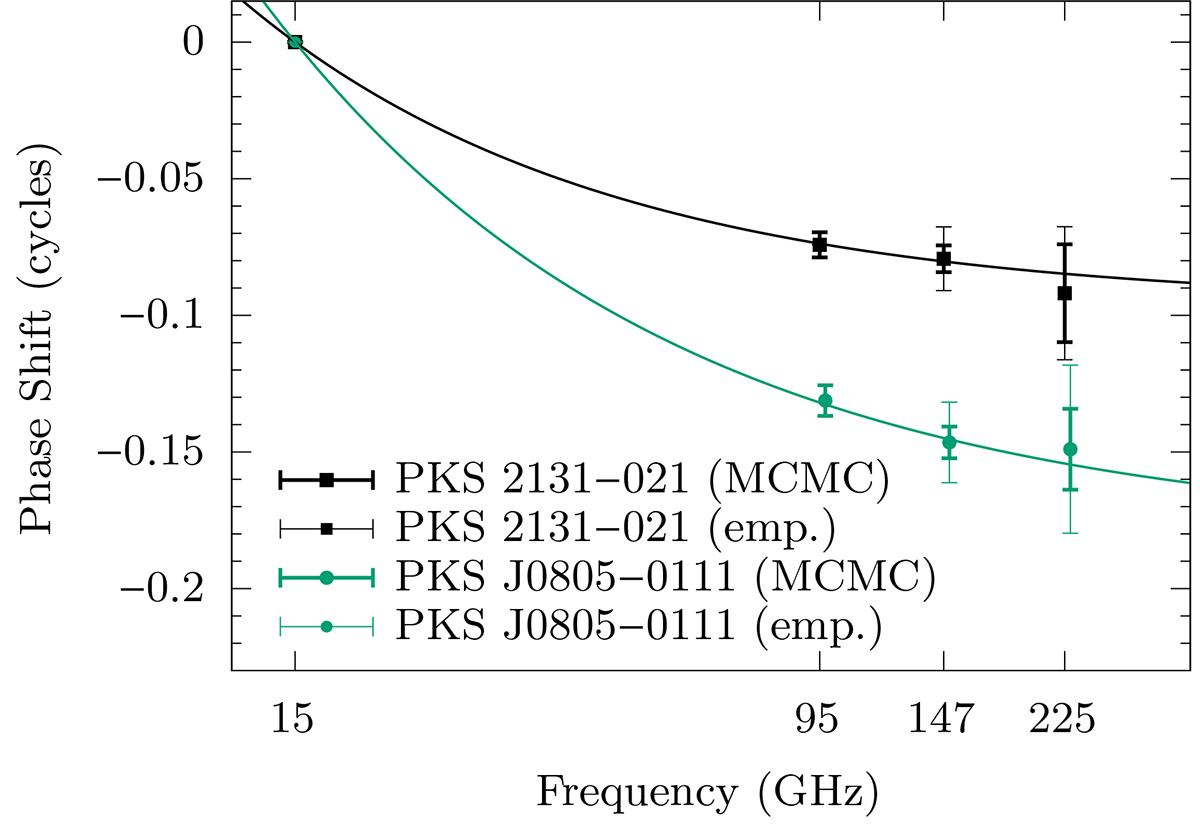
Fig. 6.
Download original image
Phase shifts of the ACT best-fit sinusoids relative to the OVRO 15 GHz light curves for each of PKS 2131–021 and PKS J0805–0111. The lines are the best fits to the power law of Eq. (4), with only ACT data included. The best-fitting values are listed in Table 5. The heavy error bars are the fiducial uncertainties of the phase shifts from the MCMC fits (Sect. 3.1) relative to 15 GHz, while the light error bars show an empirically derived, relative phase uncertainty between 95 GHz and 147–225 GHz (see Appendix C.1). Fits were done with the fiducial uncertainties. The PKS J0805–0111 points have been shifted slightly to the right for ease of viewing.
Current usage metrics show cumulative count of Article Views (full-text article views including HTML views, PDF and ePub downloads, according to the available data) and Abstracts Views on Vision4Press platform.
Data correspond to usage on the plateform after 2015. The current usage metrics is available 48-96 hours after online publication and is updated daily on week days.
Initial download of the metrics may take a while.