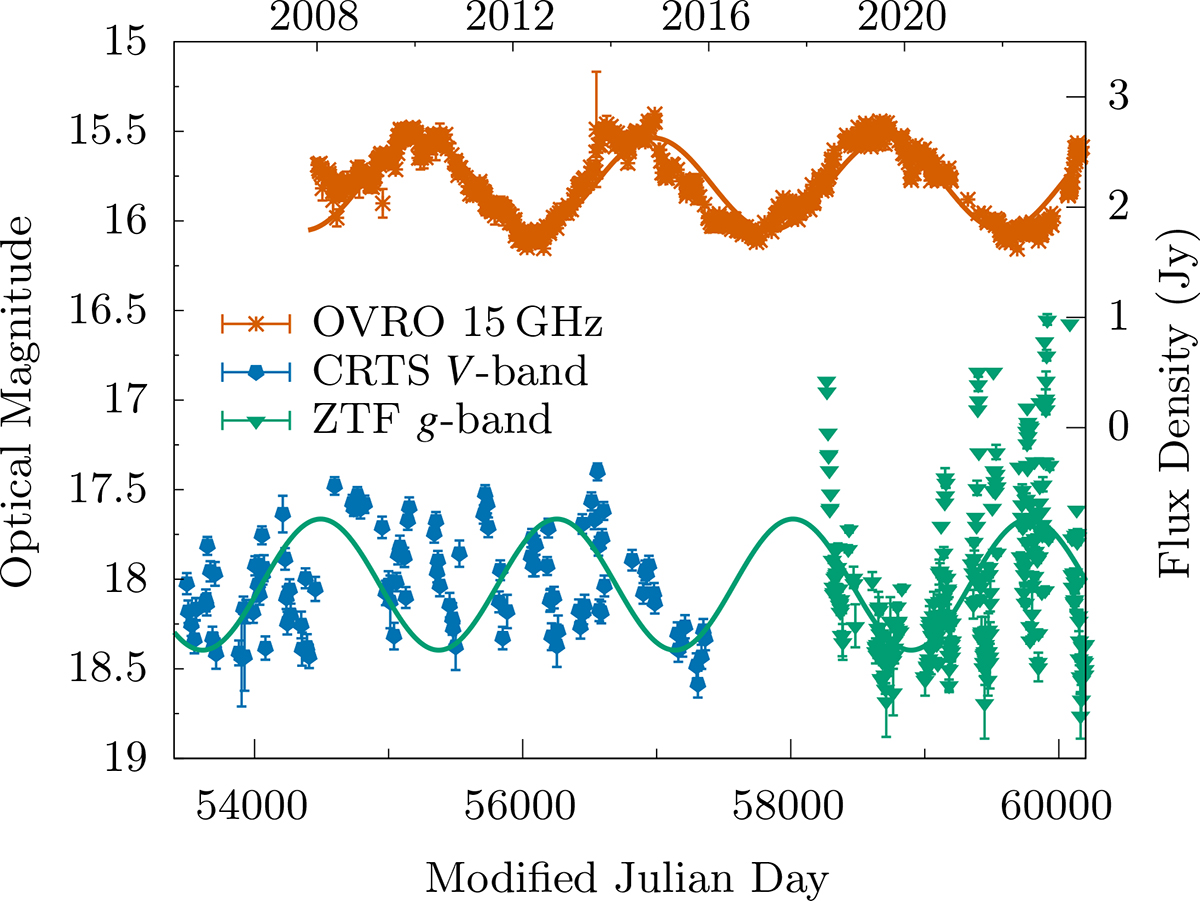
Fig. 8.
Download original image
Comparison of radio and optical light curves of PKS 2131–021. The sine waves shown in the figure come from Tables 1 and 4 of K25 for the radio and ZTF optical data, respectively. The fit to the ZTF data has been extrapolated back in time to show that the cadence of the CRTS is not sufficient to easily discover this sinusoidal pattern (see text for additional details).
Current usage metrics show cumulative count of Article Views (full-text article views including HTML views, PDF and ePub downloads, according to the available data) and Abstracts Views on Vision4Press platform.
Data correspond to usage on the plateform after 2015. The current usage metrics is available 48-96 hours after online publication and is updated daily on week days.
Initial download of the metrics may take a while.