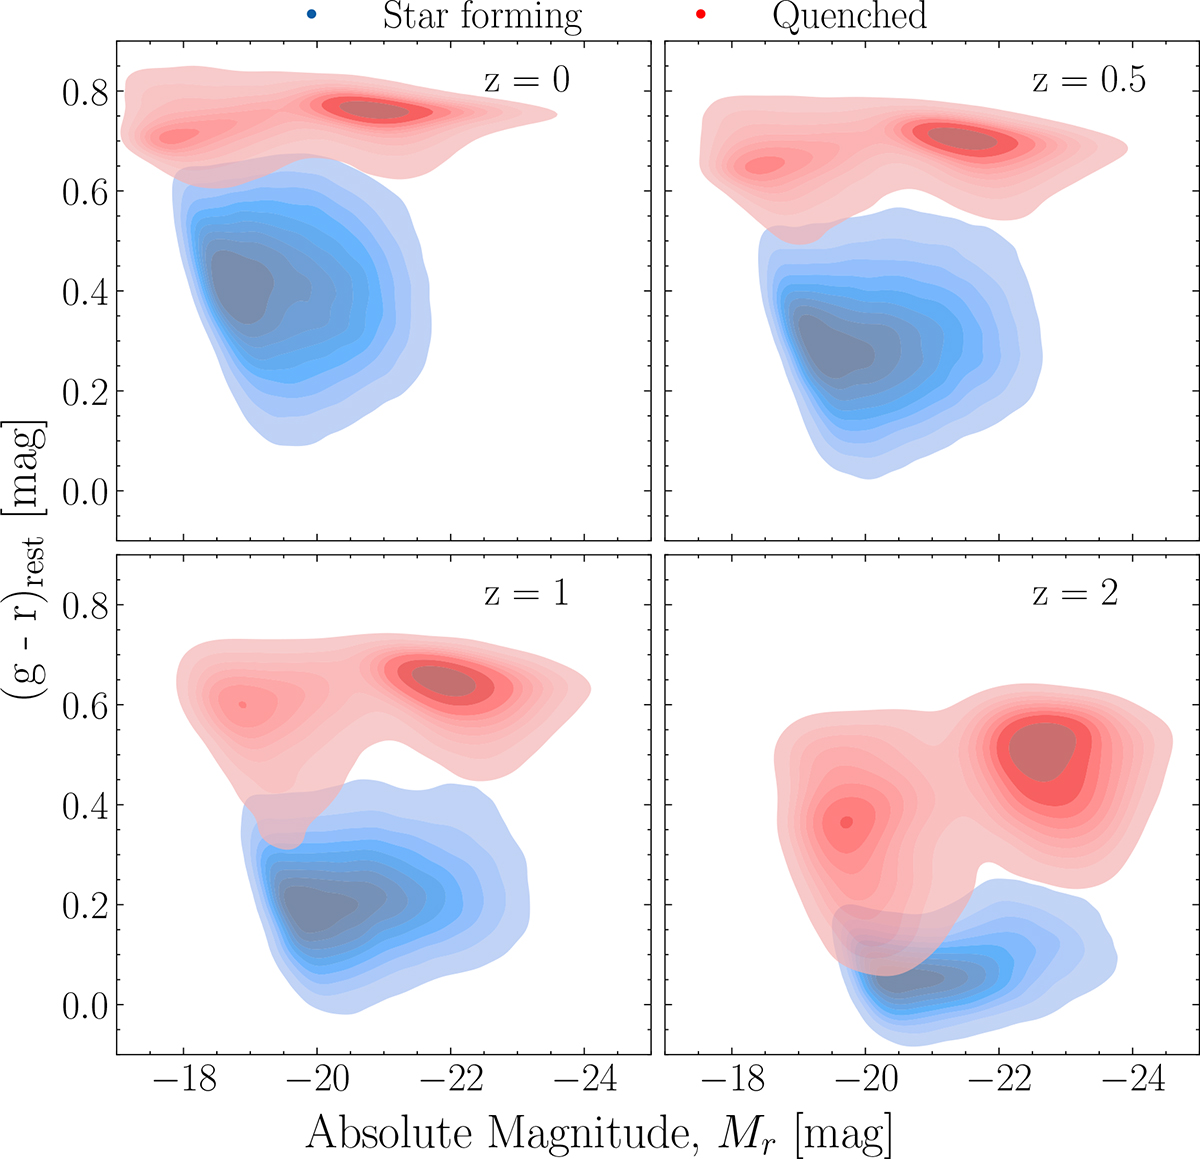
Fig. 1.
Download original image
Rest-frame color-magnitude diagram of TNG-300 galaxies with M★ > 109 h−1 M⊙. The results for galaxies with specific star formation rates greater and smaller than log10(sSFR [yr−1]) = −11 are shown in blue and red, respectively. The contours denote deciles of the populations; the darker shaded areas indicate the most densely populated regions.
Current usage metrics show cumulative count of Article Views (full-text article views including HTML views, PDF and ePub downloads, according to the available data) and Abstracts Views on Vision4Press platform.
Data correspond to usage on the plateform after 2015. The current usage metrics is available 48-96 hours after online publication and is updated daily on week days.
Initial download of the metrics may take a while.