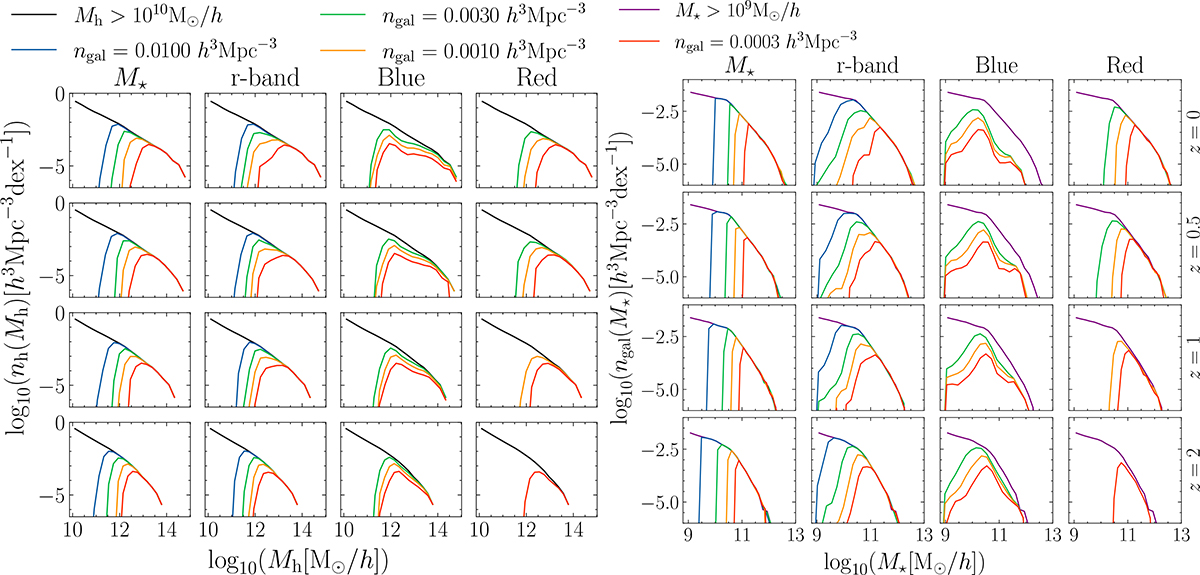
Fig. 2.
Download original image
Halo mass function (left panels) and stellar mass function (right panels) for the stellar mass, r-band, blue, and red samples. Each column corresponds to a different sample, while the rows represent the results at different redshifts. The colored lines show the mass functions for samples with distinct number densities. The black lines in the left panels display the halo mass function for Mh > 1010 h−1 M⊙ halos, while the purple lines in the right panels depict the stellar mass function M★ > 109 h−1 M⊙ galaxies.
Current usage metrics show cumulative count of Article Views (full-text article views including HTML views, PDF and ePub downloads, according to the available data) and Abstracts Views on Vision4Press platform.
Data correspond to usage on the plateform after 2015. The current usage metrics is available 48-96 hours after online publication and is updated daily on week days.
Initial download of the metrics may take a while.