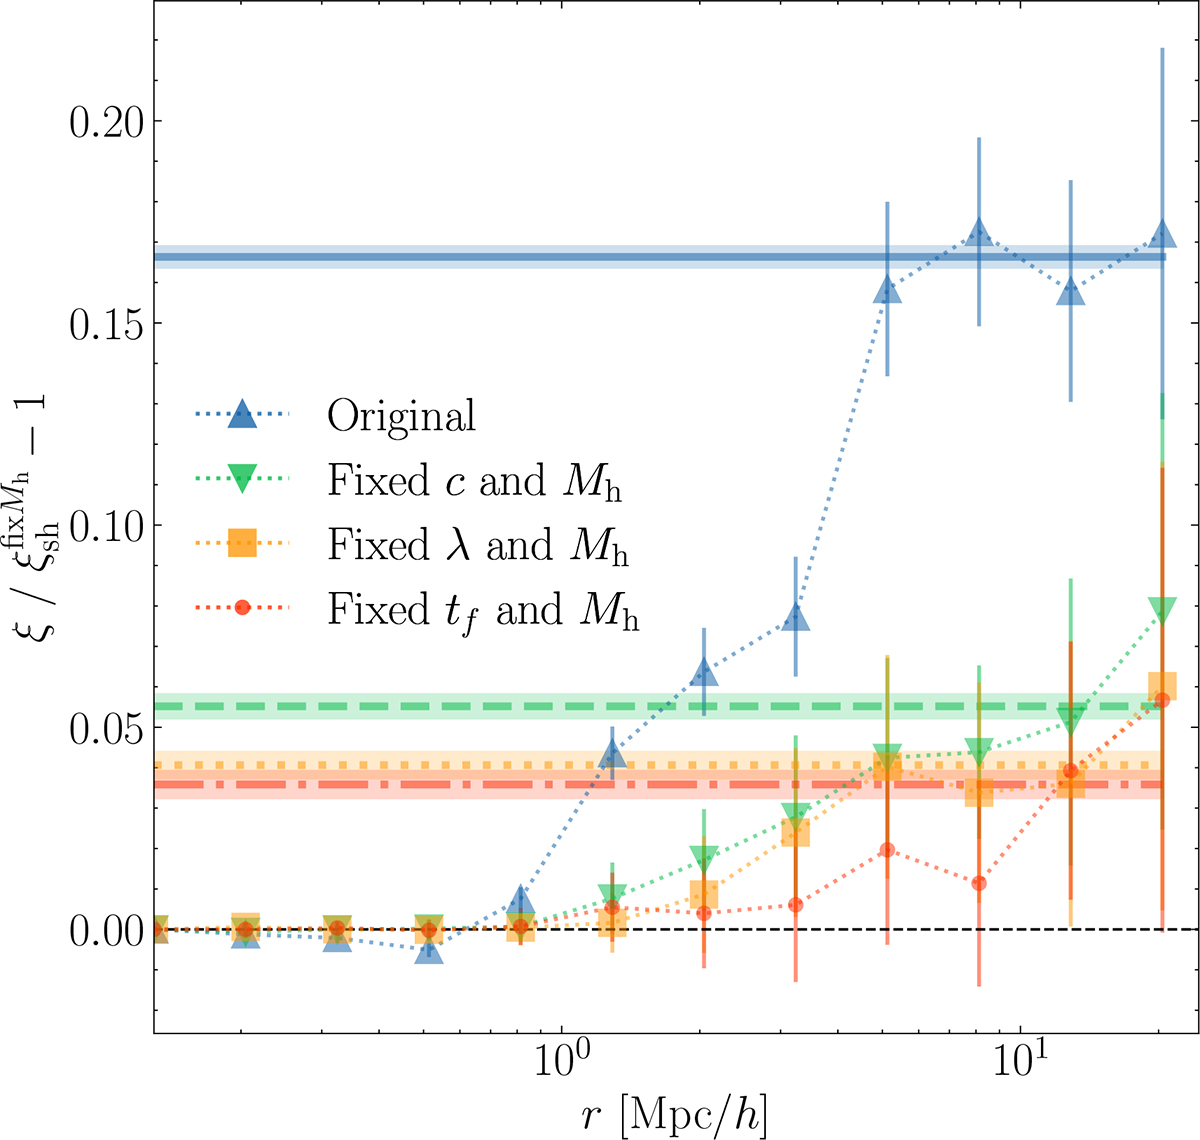
Fig. 3.
Download original image
Galaxy assembly bias for the stellar mass sample with number density n = 0.003 h3 Mpc−3 at z = 0. The blue symbols show the ratio of the clustering of this sample and of a modified version where galaxies are shuffled among halos of the same mass. The green, orange and red symbols show this ratio for modified versions of this sample where galaxies are shuffled among halos of the same mass and concentration, spin, and formation time, respectively. Horizontal lines display the average ratio on large scales, which corresponds to the level of galaxy assembly bias. The error bars and shaded areas indicate 1σ uncertainties.
Current usage metrics show cumulative count of Article Views (full-text article views including HTML views, PDF and ePub downloads, according to the available data) and Abstracts Views on Vision4Press platform.
Data correspond to usage on the plateform after 2015. The current usage metrics is available 48-96 hours after online publication and is updated daily on week days.
Initial download of the metrics may take a while.