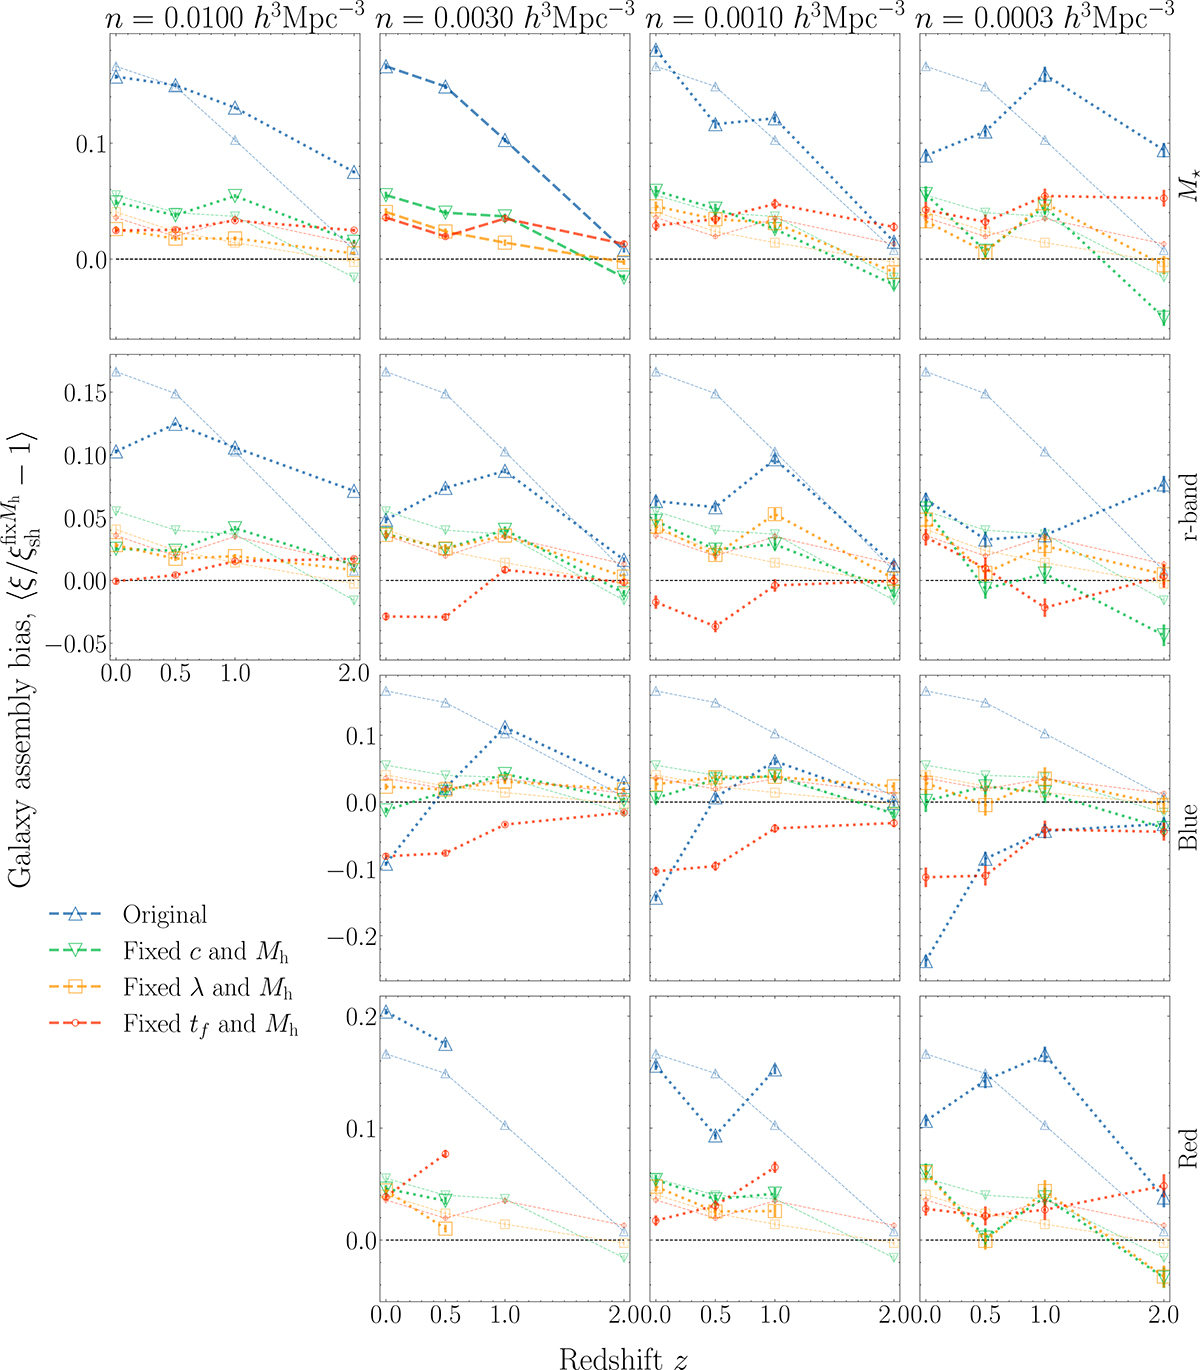
Fig. 4.
Download original image
Measurements of galaxy assembly bias captured by each secondary property from the stellar mass, r-band, blue, and red galaxy samples (rows) across different number densities (columns) as a function of redshift. The y-axis displays our measurements of galaxy assembly bias, which we extract by averaging from 8 to 25 h−1 Mpc the ratio of galaxy clustering of the sample shown in the legend and that of a modified version where galaxies are shuffled among halos of the same mass. In all panels, for ease of comparison, the symbols connected by dashed lines represent the results for the stellar mass sample with n = 0.003 h3 Mpc−3. The level of galaxy assembly bias varies significantly across samples, redshifts, and number density, increasing or decreasing galaxy clustering by as much as ≃24%.
Current usage metrics show cumulative count of Article Views (full-text article views including HTML views, PDF and ePub downloads, according to the available data) and Abstracts Views on Vision4Press platform.
Data correspond to usage on the plateform after 2015. The current usage metrics is available 48-96 hours after online publication and is updated daily on week days.
Initial download of the metrics may take a while.