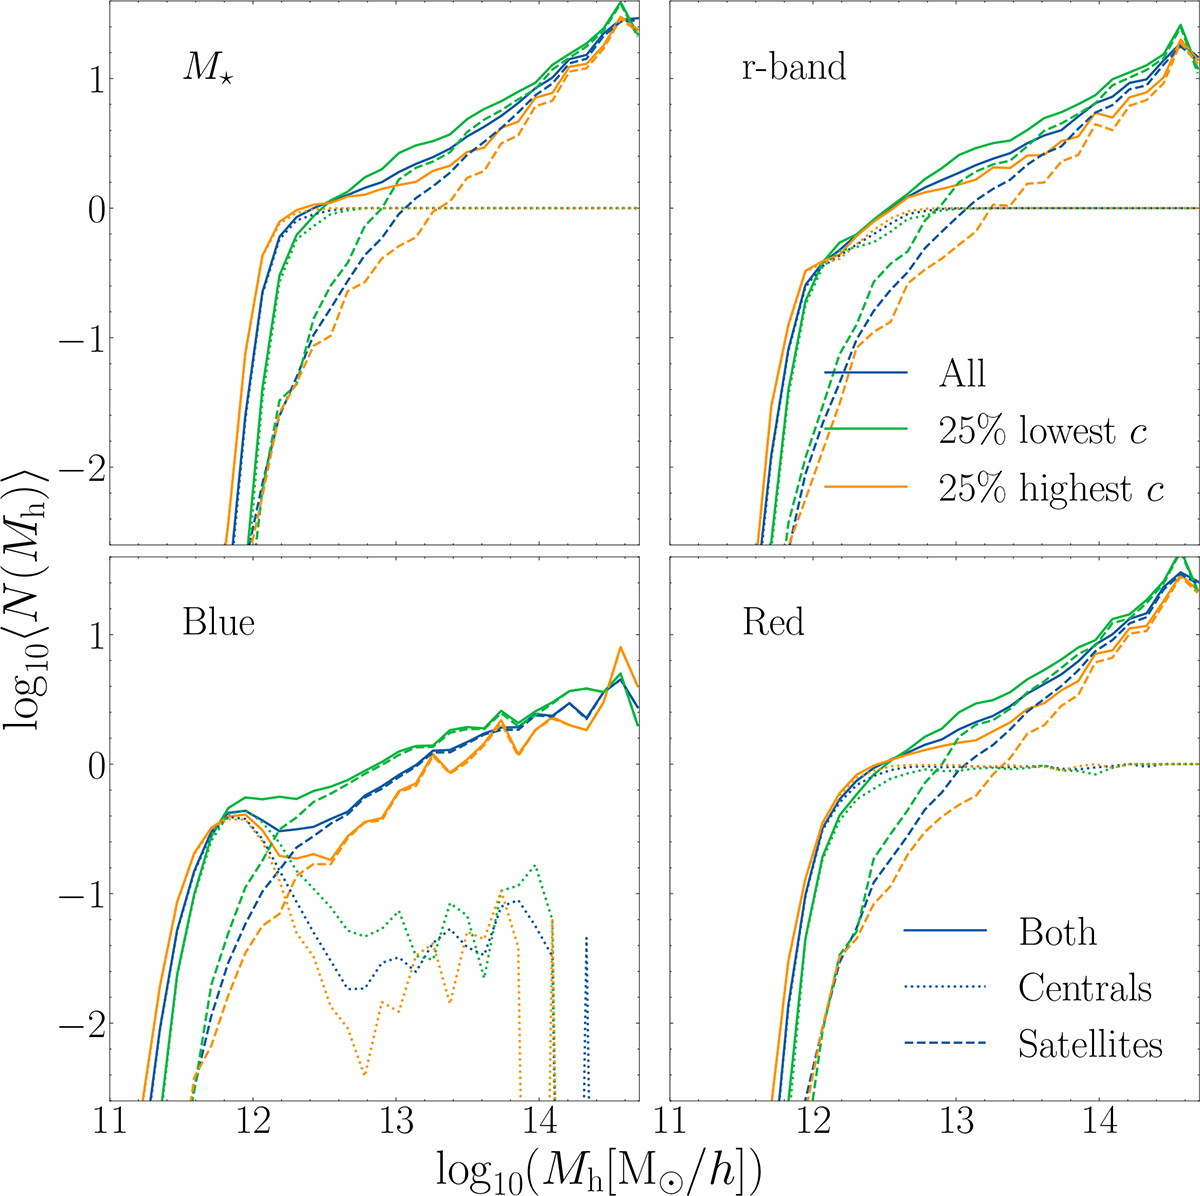
Fig. 6.
Download original image
In clockwise direction, halo occupation distribution for stellar mass, r-band, blue, and red galaxy samples with n = 0.003 h3 Mpc−3 at z = 0. The solid, dotted, and dashed lines show the results for all galaxies, centrals, and satellites, respectively. The results for the 25% of galaxies with the highest and lowest concentration are in orange and green, respectively, while the complete sample is in blue. We note that the occupancy of halos depends on the concentration for all galaxy samples.
Current usage metrics show cumulative count of Article Views (full-text article views including HTML views, PDF and ePub downloads, according to the available data) and Abstracts Views on Vision4Press platform.
Data correspond to usage on the plateform after 2015. The current usage metrics is available 48-96 hours after online publication and is updated daily on week days.
Initial download of the metrics may take a while.